Article Text

Abstract
Background Governments have endorsed global targets to reduce childhood undernutrition as part of the Sustainable Development Goals. Understanding the socioeconomic differences in childhood undernutrition has the potential to be helpful for targeting policy to reach these goals.
Methods We specify a logistic regression model with the Composite Index of Anthropometric Failure (CIAF) as the outcome and indicator variables for wealth quartiles, maternal education categories and a set of covariates as explanatory variables. Wealth and education variables are interacted with a period indicator for 1990–2000 compared with 2001–2014 to observe differences over time. Based on these regressions we calculate predicted CIAF prevalence by wealth and education categories and over time.
Results The sample included 146 surveys from 39 low-income and lower-middle-income countries with an overall sample size of 533 217 children. CIAF prevalence was 47.5% in 1990–2000, and it declined to 42.6% in 2001–2014. In 1990–2000 the CIAF prevalence of children with mothers with less than primary education was 31 percentage points higher than for mothers with secondary or higher education. This difference slightly decreased to 27 percentage points in 2001–2014. The difference in predicted CIAF prevalence of children from the highest and lowest wealth quartiles was 21 percentage points and did not change over time.
Conclusions We find evidence for persistent and even increasing socioeconomic inequalities in childhood undernutrition, which underlines the importance of previous calls for equity-driven approaches targeting the most vulnerable to reduce childhood malnutrition.
- Childhood undernutrition
- Inequality
- CIAF
This is an Open Access article distributed in accordance with the Creative Commons Attribution Non Commercial (CC BY-NC 4.0) license, which permits others to distribute, remix, adapt, build upon this work non-commercially, and license their derivative works on different terms, provided the original work is properly cited and the use is non-commercial. See: http://creativecommons.org/licenses/by-nc/4.0/
Statistics from Altmetric.com
Key questions
What is already known about this topic?
Evidence exists for socioeconomic inequalities in stunting in low-income and middle-income countries.
There is no comprehensive study for Composite Index of Anthropometric Failure and other childhood undernutrition outcomes.
What are the new findings?
There are large and persistent inequalities in childhood undernutrition by wealth and education.
Recommendations for policy
The findings underline the importance of equity for targeting childhood undernutrition prevalence in low-income and middle-income countries.
Introduction
Childhood undernutrition is linked to 45% of all child deaths,1 lower adult height, lower educational achievement and lower economic productivity in later life.2 The global burden of childhood undernutrition is concentrated in low-income and lower-middle-income countries. In light of the severe consequences related to childhood undernutrition, governments have endorsed global targets to reduce chronic undernutrition (stunting) by 40% by 2025 and to reduce and maintain the prevalence of acute undernutrition (wasting) to less than 5% in children under 5 years of age.3 The achievement of these targets is also supported by Sustainable Development Goal (SDG) 2.4 It has been argued that good nutrition is essential for achieving many of the other SDGs.5
The existing body of evidence on inequalities in childhood undernutrition has focused on single indicators and on economic dimensions at single time points. Furthermore, the commonly used indicators of stunting, wasting, and underweight partly overlap and therefore do not provide a comprehensive estimate of the proportion of undernourished children in the population.6 We therefore analysed 146 data sets from 39 countries to assess trends in childhood undernutrition across socioeconomic indicators.
Methods
Data sources
The data for this study is from the Demographic and Health Surveys (DHS). These surveys are administered by ICF International and are nationally representative cross-sectional surveys in low- and middle-income countries. They are conducted at varying intervals from 1985 and are still ongoing.
Sampling plan
The DHS used a multistage, stratified sampling design. Each country was divided into regions and within these subnational regions, populations were stratified by urban and rural areas of residence. Within these stratified areas a random selection of enumeration areas taken from the most recent population census was drawn. These primary sampling units (PSU) were selected with a probability proportional to the population size. In the second stage of sampling, on average 25 households within the PSU were randomly selected for an interview by equal probability systematic sampling.
Within each sampled household the household members were listed and women eligible for a more detailed interview were identified. Typically, this was a woman who was between the ages of 15 and 49. In some surveys the interview was limited to ever-married women, and in others it was women aged 10–49. Details of height and weight at the time of the interview were recorded for children born in the last 3 to 5 years. The DHS provided weights for calculating nationally representative statistics. Survey data from DHS surveys are distributed in recode format. For the study, the child recode is used, which contains one record for every child of the interviewed woman born in the 5 years preceding the interview. The study sample is restricted to countries for which at least two DHS are available and information on anthropometric outcomes is included, allowing analysis of trends over time. Depending on the country, anthropometric outcomes of children are available for children aged between 0 and 35 months and between 0 and 60 months. To allow cross-country comparisons and comparisons over time, we restrict the age of children to less than 36 months. The study sample consists of 146 surveys from 39 countries, resulting in information on 590 185 children aged between 0 and 35 months, capturing a period between 1991 and 2014. A detailed list of the survey years by countries can be found in table 1.
List of countries and survey years used in the analysis
Outcome measures
The outcome is the Composite Index of Anthropometric Failure (CIAF) for children under 3 years of age. The CIAF incorporates the three forms of undernutrition: stunting, underweight and wasting, and thus provides a single aggregate figure of all undernourished children in the population.7 The CIAF is a binary variable, which is one if a child is either stunted, underweight, wasted or any combination of the three. The Composite Index of Severe Anthropometric Failure (CISAF) is a binary variable, which is one if a child is either severely stunted, severely underweight, severely wasted or any combination of the three. Stunting is defined as low height for age, underweight as low weight for age, and wasting as low weight for height. z-Scores are evaluated relative to the WHO reference population and z-scores of less than −2 SD define undernutrition for the respective indicator. z-Scores of less than −3 SD define severe undernutrition for the respective indicator. For all surveys, we calculate the z-scores using the new WHO growth standard, which allows comparisons over time.8 We focus on children under 3 years of age to have a comparable sample across countries, because in some surveys anthropometric data for children between 3 and 5 years does not exist. Biologically implausible values are defined by the WHO for height (stunting) as z-scores <−6 or >6; for weight (underweight) as <−6 or >5; and for weight for height (wasting) as <−5 or >5. Observations with these biologically implausible values were dropped.8
Exposure
The two main exposure variables are wealth and education. To account for wealth we constructed an asset index using principal component analysis of a range of household assets, such as electricity, radios, televisions, quality of dwelling and type of drinking water source. Observations are then divided into quartiles according to their value of the asset index and a categorical wealth exposure variable for the four quartiles is constructed.9
Education information in DHS data sets was coded in a way that allows comparison across countries despite differences in educational systems. We construct a categorical variable for maternal education using the levels ‘no or less than primary education’, ‘primary or incomplete secondary education’ and ‘secondary education and above’.
Covariates
Our choice of covariates was motivated by the UNICEF conceptual framework of causes of undernutrition.10 Covariates include indicator variables for the age and sex of the child and the birth order. Child age was classified into four categories: 0–5 months, ‘between 6 an 11 months’, ‘between 12 and 23 months’ and ‘between 24 and 35 months’. Further covariates include an indicator variable for rural versus urban location of the household, the marital status of the mother defined by a categorical variable ‘has partner/no partner’, and the age of the mother at birth of the child. Age at birth was defined by a variable with the following categories: ‘less than 14 years’, ‘between 15 and 19 years’, ‘between 20 and 24 years’, ‘between 25 and 29 years’, ‘between 30 and 34 years’, ‘between 35 and 39 years’, ‘between 40 and 44 years’, and ‘between 45 and 49 years’. Further we define dummy variables for the time period the survey was conducted, between 1990 and 2000, or between 2001 and 2014.
Statistical analysis
We specify a multilevel logistic regression model with the CIAF and CISAF as outcome variables and indicator variables for the wealth quartiles and education categories, as well as the above-mentioned covariates as explanatory variables. We estimate a two-level model with the child data as level 1 and country as level 2. We further include an indicator variable for the survey period between 2001 and 2014 as an explanatory variable and interact it with the wealth and education categories. All regression results are unweighted, following recommendations provided by the DHS manual. SEs are clustered at the PSU level. We predict the prevalence of CIAF and CISAF in each time period based on these regression results for each wealth and education category. The analysis is also performed using stunting, underweight and wasting, as well as their severe forms, and all results are shown in the online supplementary appendix.
Ethics
The DHS data collection procedures were approved by the ICF Macro International (Calverton, Maryland, USA) Institutional Review Board, as well as by the relevant body in each country that approves research studies on human subjects. Oral informed consent for the interview/survey was obtained from respondents by interviewers.
Results
The original sample included all DHS that contain anthropometric data and comprised 159 surveys from 51 countries conducted between 1990 and 2014. The surveys to calculate the CIAF and CISAF indicator included a total of 590 185 observations for children aged between 0 and 35 months. There were 17 357 observations that were lost for countries that only have one survey and therefore do not allow comparisons over time. Another 39 611 observations were lost due to missing observations in the outcome variable and to missing data in covariate. The final CIAF and CISAF samples for the main analysis include 146 surveys from 39 countries with an overall sample size of 533 217 children. The sample composition for stunting, underweight and wasting is shown in online supplementary figure A1.
CIAF prevalence was 47.5% in 1990–2000 and it declined to 42.6% in 2001–2014. CISAF prevalence declined from 23.7% to 20.3%. We observe wealth and education gradients in CIAF prevalence in both periods. In 2001–2014 CIAF prevalence was 51.4% for the poorest quartile and 30.1% for the richest quartile. It was 50.9% for children of mothers with less than primary education and 22.9% for mothers with secondary or higher education. All differences are purely descriptive and not adjusted for covariates (table 2). Predicted prevalence of CIAF and CISAF adjusted for the full set of covariates was quite similar to the unadjusted prevalence (table 3). The corresponding results for stunting, underweight and wasting, as well as by country, are shown in online supplementary tables A1–A3.
Bivariate distribution of the prevalence of CIAF and CISAF among children aged less than 3 in the final analytic sample by wealth quintile and by mother’s attained education for the periods 1990–2000 and 2001–2014
Predicted prevalence (PP) and 95% CIs of CIAF and CISAF among children aged less than 3 in the final analytic sample by country for the periods 1990–2000 and 2001–2014
In 1990–2000 the CIAF prevalence of children with mothers with less than primary education was 31.7 percentage points greater than for mothers with secondary or higher education. This difference slightly decreased to 27.4 percentage points in 2001–2014. Differences in predicted CIAF prevalence of children from the highest and lowest wealth quartiles were 21.3 percentage points in 1990–2000 and only marginally decreased to 20.0 percentage points in 2001–2014. The relative difference in CIAF prevalence between the poorest and richest quartile decreased from a factor of 2.4 in 1990–2000 to a factor of 2.2 in 2001–2014. The relative difference between the lowest and highest education category slightly increased from a factor of 1.6 in 1990–2000 to a factor of 1.7 in 2001–2014 (figure 1). The corresponding estimates for stunting, underweight and wasting are shown in online supplementary figures A2–A4.

Absolute and relative differences in predicted prevalence of CIAF and CISAF between lowest and highest wealth and education categories for 1990–2000 and 2001–2014. Predicted prevalence is based on regression models adjusting for age in months, gender, birth order of child, age of mother at birth, household wealth, matejrnal education, urban residence and marital status of mother. Source: Demographic and Health Surveys data. CIAF, Composite Index of Anthropometric Failure; CISAF, Composite Index of Severe Anthropometric Failure.
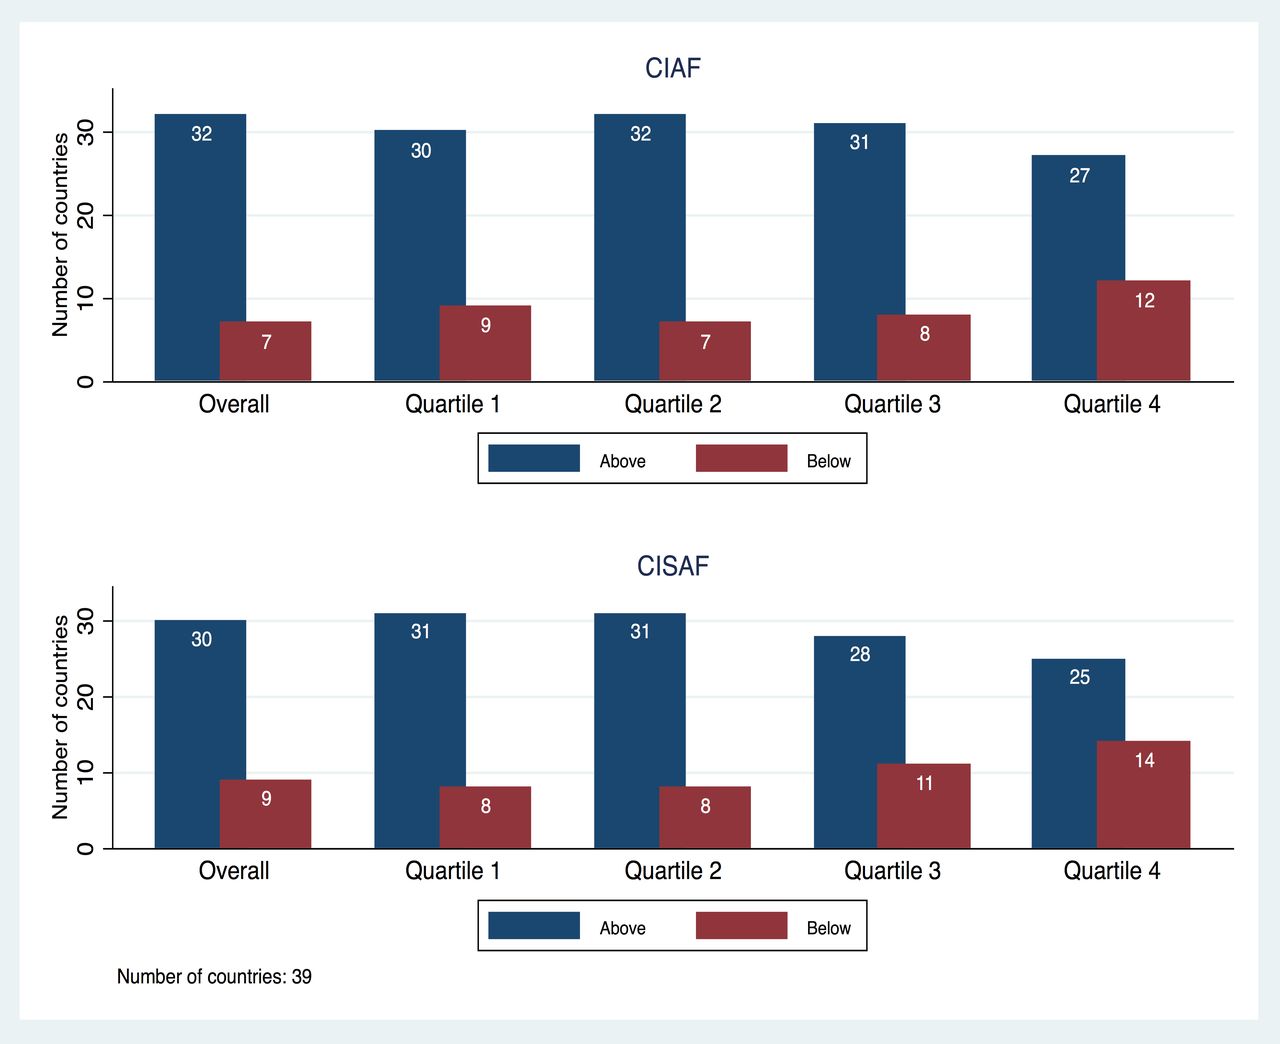
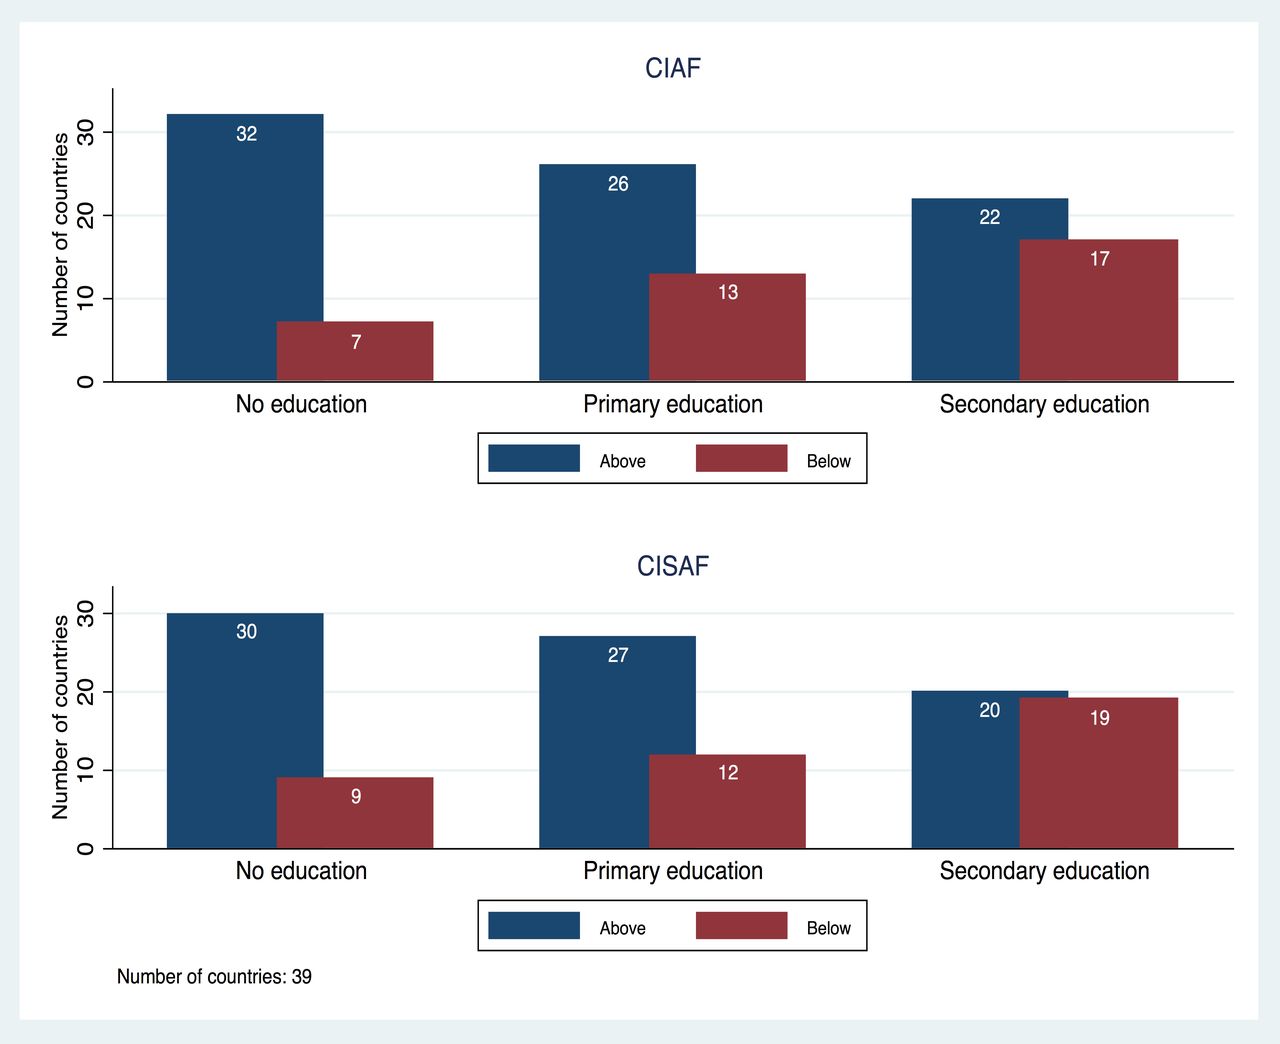
Predicted CIAF prevalence increased in seven countries and decreased in the remaining 32 countries. Increases were seen in Armenia, Benin, Burkina Faso, Madagascar, Morocco, Zambia and Zimbabwe. The highest decrease was seen in Ethiopia (figure 2). Predicted CISAF prevalence increased in nine countries (figure 3). Besides the total sample, figure 3 also shows the number of countries where the predicted prevalence in CIAF and CISA among children ages between 0 and 35 months is smaller or larger in the period 2001–2014 compared with the period 1990–2000 by asset index quartiles. For households belonging to the richest quartile, the predicted CIAF prevalence increased in 12 countries, and the predicted CIAF prevalence increased in 14 countries between the periods 1990–2000 and 2001–2014 (figure 3). Figure 4 shows the number of countries where the predicted prevalence in CIAF and CISAF is higher or lower in the period 2001–2014 compared with the period 1990–2000. Predicted CIAF prevalence increased in seven countries for children of mothers with less than primary education and in 17 countries for children of mothers with more than secondary education between 1990–2000 and 2001–2014. For the CISAF the respective numbers were 9 and 19 (figure 4). The results for each country are shown in online supplementary figures A5–A6, and the country-level results for stunting, underweight and wasting are shown in online supplementary figures A7–A9.
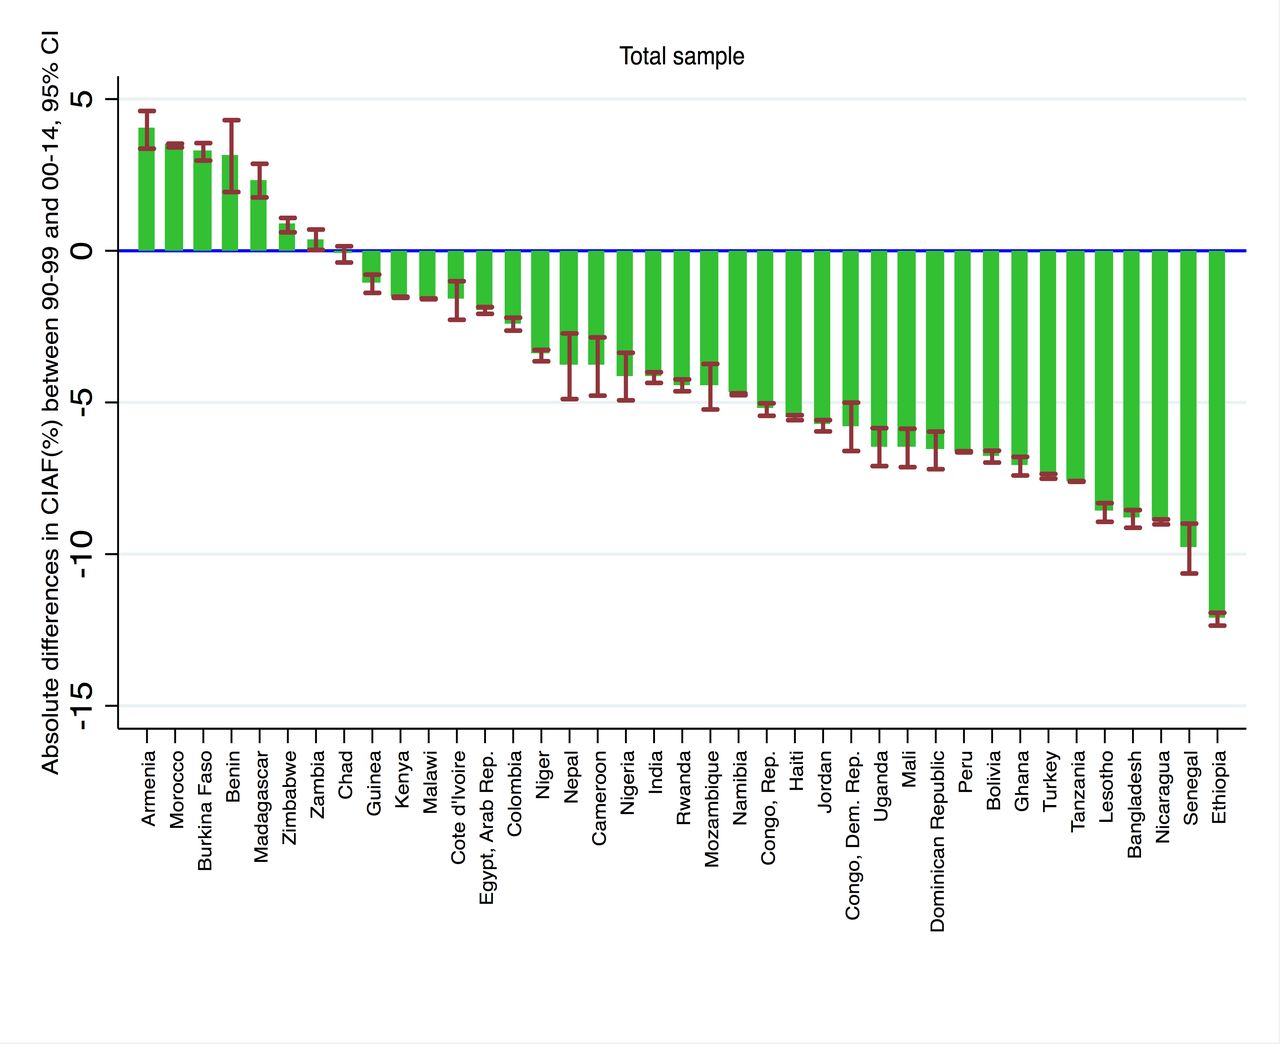
Absolute differences in predicted prevalence of CIAF among children aged less than 3 in the final analytic sample between the periods 1990–2000 and 2001–2014 for the total sample. Predicted prevalence is based on regression models adjusting for age in months, gender, birth order of child, age of mother at birth, household wealth, maternal education, urban residence and marital status of mother. Source: Demographic and Health Surveys data. CIAF, Composite Index of Anthropometric Failure.

Number of countries for which predicted prevalence in CIAF and CISAF among children aged less than 3 increased from 1990–2000 to 2001–2014 in the full sample and by wealth quartiles. Predicted prevalence is based on regression models adjusting for age in months, gender, birth order of child, age of mother at birth, household wealth, maternal education, urban residence and marital status of mother. Source: Demographic and Health Surveys data. CIAF, Composite Index of Anthropometric Failure; CISAF, Composite Index of Severe Anthropometric Failure.

Number of countries for which predicted prevalence in CIAF and CISAF among children aged less than 3 increased from 1990–2000 to 2001–2014 by educational attainment of the mother. Predicted prevalence is based on regression models adjusting for age in months, gender, birth order of child, age of mother at birth, household wealth, maternal education, urban residence and marital status of mother. Source: Demographic and Health Surveys data. CIAF, Composite Index of Anthropometric Failure; CISAF, Composite Index of Severe Anthropometric Failure.
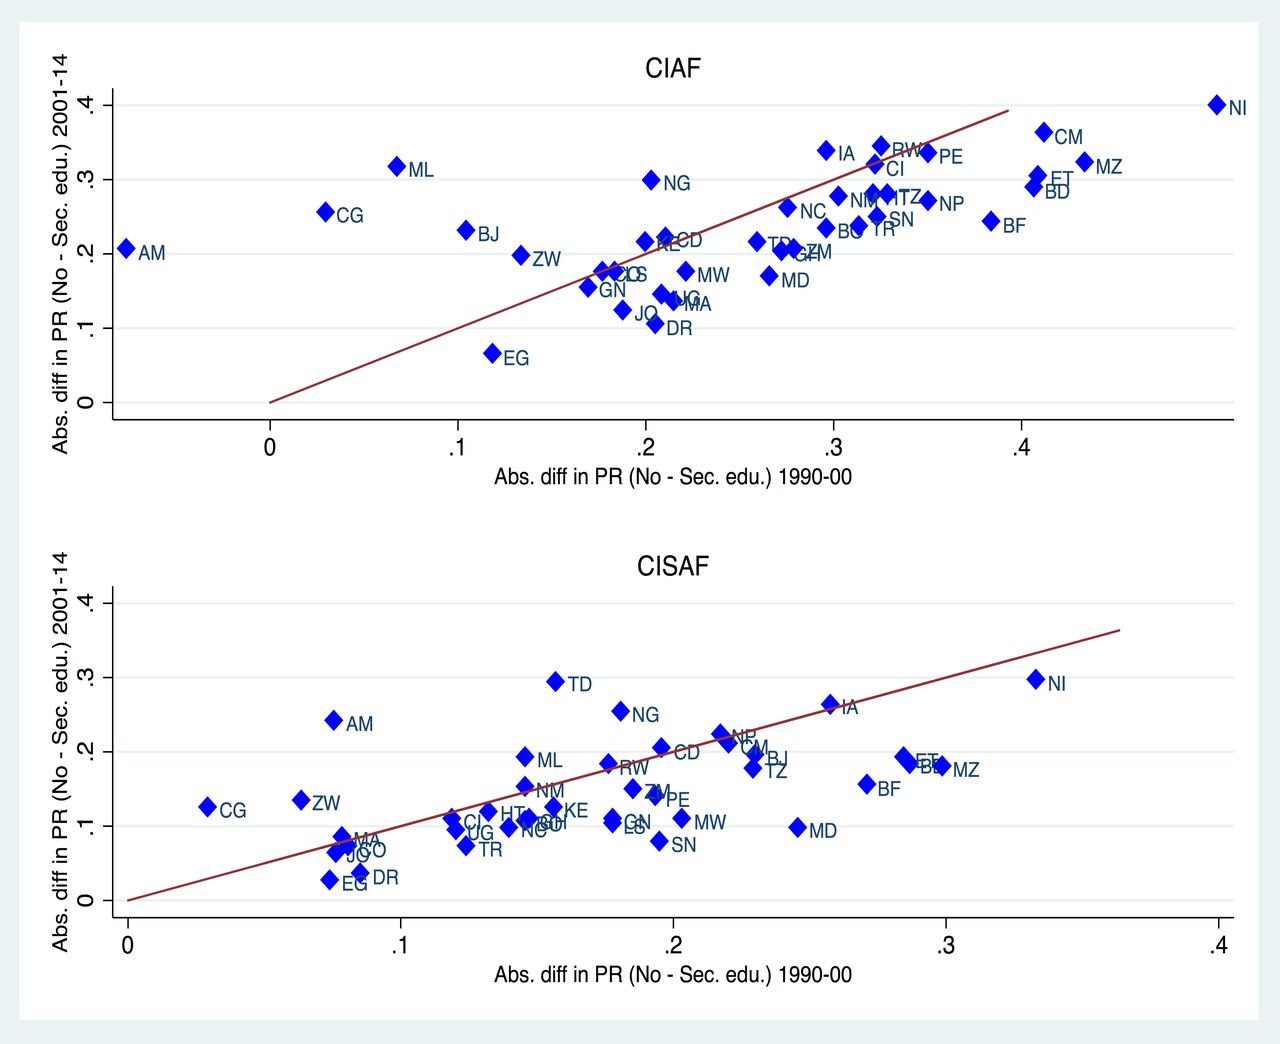
In figures 5 and 6 we compare the gap in predicted CIAF and CISAF prevalence between the richest and poorest wealth quintile and the highest and lowest education category, by country and over time. Observations above the diagonal indicate that the gap in predicted CIAF prevalence between the richest and poorest quartile (highest and lowest education category, respectively) in this country increased over time. There is a substantial number of countries for which the socioeconomic gap in predicted CIAF and CISAF prevalence increased. The country-level analysis for (severe) stunting, underweight and wasting is shown in online supplementary figures A10–A11.
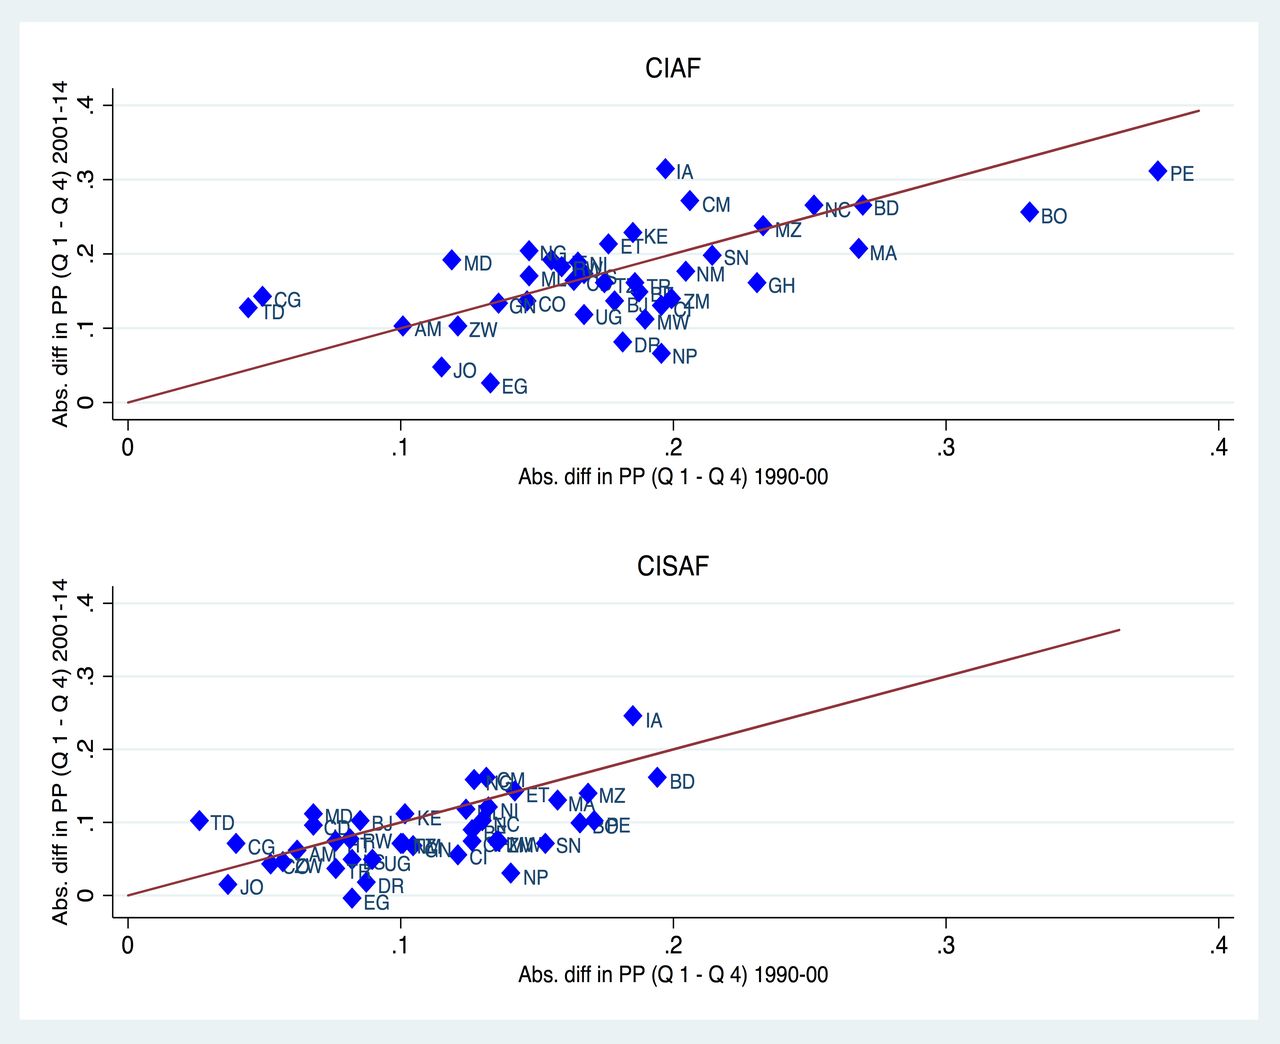
Absolute differences between the poorest and richest quartile predicted prevalence (PP) in CIAF and CISAF among children aged less than 3 in 1990–2000 and 2001–2014. PP is based on regression models adjusting for age in months, gender, birth order of child, age of mother at birth, household wealth, maternal education, urban residence and marital status of mother. Source: Demographic and Health Surveys data. Country codes: AM (Armenia), BD (Bangladesh), BJ (Benin), BO (Bolivia), BF (Burkina Faso), CM (Cameroon), TD (Chad), CO (Colombia), CD (Congo, Democratic Republic), CG (Congo, Republic), CI (Cote d'Ivoire), DR (Dominican Republic), EG (Egypt, Arab Republic), ET (Ethiopia), GH (Ghana), GN (Guinea), HT (Haiti), IA (India), JO (Jordan), KE (Kenya), LS (Lesotho), MD (Madagascar), MW (Malawi), ML (Mali), MA (Morocco), MZ (Mozambique), NM (Namibia), NP (Nepal), NC (Nicaragua), NI (Niger), NG (Nigeria), PE (Peru), RW (Rwanda), SN (Senegal), TZ (Tanzania), TR (Turkey), UG (Uganda), ZM (Zambia), ZW (Zimbabwe). CIAF, Composite Index of Anthropometric Failure; CISAF, Composite Index of Severe Anthropometric Failure.
Absolute differences between the no education and secondary or higher education of the mother predicted prevalence (PP) in CIAF and CISAF among children aged less than 3 in 1990–2000 and 2001–2014. Predicted prevalence is based on regression models adjusting for age in months, gender, birth order of child, age of mother at birth, household wealth, maternal education, urban residence and marital status of mother. Source: Demographic and Health Surveys data. Country codes: AM (Armenia), BD (Bangladesh), BJ (Benin), BO (Bolivia), BF (Burkina Faso), CM (Cameroon), TD (Chad), CO (Colombia), CD (Congo, Democratic Republic), CG (Congo, Republic), CI (Cote d'Ivoire), DR (Dominican Republic), EG (Egypt, Arab Republic), ET (Ethiopia), GH (Ghana), GN (Guinea), HT (Haiti), IA (India), JO (Jordan), KE (Kenya), LS (Lesotho), MD (Madagascar), MW (Malawi), ML (Mali), MA (Morocco), MZ (Mozambique), NM (Namibia), NP (Nepal), NC (Nicaragua), NI (Niger), NG (Nigeria), PE (Peru), RW (Rwanda), SN (Senegal), TZ (Tanzania), TR (Turkey), UG (Uganda), ZM (Zambia), ZW (Zimbabwe). CIAF, Composite Index of Anthropometric Failure; CISAF, Composite Index of Severe Anthropometric Failure.
Discussion
We have presented prevalence as well as predicted prevalence of CIAF and CISAF by wealth and maternal education categories for all low-income and lower-middle-income countries for which mutually comparable DHS-based anthropometric data of children exist. While the overall CIAF and CISAF prevalence is slowly decreasing, we find that the percentage point difference in predicted CIAF prevalence between the poorest and the richest households did not change over time and as a consequence even increased if measured in relative terms. The percentage point difference in predicted CSIAF prevalence between the poorest and the richest households slightly decreased and remained constant if expressed in relative terms. For levels of maternal education, both the percentage point difference as well as the ratio of predicted CIAF and CISAF prevalence between the lowest and the highest education categories slightly decreased. For a substantial number of countries, the socioeconomic gap in CIAF and CISAF prevalence worsened.
Previous research on socioeconomic inequality in childhood undernutrition mostly focused on single indicators such as stunting. According to the most recent global estimates, between 1990 and 2015 the stunting prevalence declined from 39.6% to 23.2% globally. Progress towards international stunting targets is highly variable between and within countries.11 There is clear evidence from national surveys of socioeconomic inequalities in stunting within countries.12–16 To illustrate, in a multicountry analysis of 50 surveys conducted between 1990 and 2001, the stunting prevalence was 1.8 times higher in the poorest quintile of households than in the richest quintile17; in a subsequent analysis of 79 population-based surveys conducted between 2000 and 2012, the poor/rich stunting ratio was 2.47.1 These findings are also supported by an analysis of 47 population-based surveys demonstrating inequalities in stunting across wealth quintiles.18 In a trend analyses based on 179 data sets obtained between 1990 and 2011 from 80 countries, stunting inequalities persisted using a corrected concentration index.19 The increased prevalence of stunting among poor households can be explained by lower access to high-quality foods, increased exposure to health risks, as well as lower access to preventive and curative services.20 Furthermore, economic inequality may increase the risk of child stunting independent of other risk factors.21 22
To our knowledge this is the first study that systematically investigates socioeconomic inequality in undernutrition prevalence using CIAF and CISAF for all low-income and middle-income countries for which comparable data exist. We chose the CIAF and CISAF because even though the three most commonly used indicators of stunting, wasting and underweight represent different physiological forms of undernutrition, these forms of undernutrition all share similar causal factors.23 24 Individual estimates of stunting, wasting and underweight underestimate the overall burden of undernutrition. On the other hand, prevalence estimates cannot be added to comprehensively capture the burden of undernutrition given that children may suffer from more than one form of undernutrition. The use of CIAF and CIASF identifies all undernourished children and therefore provides a single estimate of the burden of undernutrition in a population.7 Nandy et al demonstrated the usability of the CIAF and CIASF using anthropometric data from a nationally representative survey from India. The researchers also showed that further disaggregating the CIAF and CIAS helped identify the most vulnerable subpopulations, as children with overlapping anthropometric failures were at highest risk for poverty and morbidity.25 These results should be re-examined using data from other countries.
We find persistent or even increasing socioeconomic differences in CIAF and CISAF prevalence. Our results therefore underline the importance of previous calls for equity-driven approaches targeting the most vulnerable to reduce child undernutrition.26 Strategies aiming to reduce childhood undernutrition should identify the most marginalised communities through data disaggregation of population-based household surveys or specialised data collections. They should then identify and strive to overcome barriers that prevent poor children and families from accessing and using nutrition services. Such strategies should be underpinned by efforts to address underlying drivers of child undernutrition.
Acknowledgments
The data for this research were collected by the Demographic and Health Surveys Program (www.dhsprogram.com), under a contract from the US Agency for International Development. We acknowledge support with the open access fee by the German Research Foundation and the Open Access Publication Funds of the University of Goettingen.
References
Footnotes
Contributors SV, KH, SVS conceptualised the study. KH analysed the data. SV contributed to the data analysis and wrote the first draft of the manuscript. KH, RK, SVS contributed to the interpretation of the results and writing.
Funding None.
Disclaimer RK is a Unicef staff member. The opinions and statements in this article are those of the author and may not reflect official Unicef policies.
Competing interests None declared.
Ethics approval The DHS data collection procedures were approved by the ICF Macro International (Calverton, Maryland) Institutional Review Board, as well as by the relevant body in each country that approves research studies on human subjects. Oral informed consent for the interview/survey was obtained from respondents by interviewers.
Provenance and peer review Not commissioned; externally peer reviewed.
Data sharing statement All data are publicly available.