Article Text

Abstract
Background While income and prices are key drivers of dietary choices, how their influence varies by food category, nation, and demographics is not well established. Based on intake data for 164 countries and 11 food categories, we examined how income and food prices relate to food intake globally, including by world region, age, and sex.
Methods We used 2010 intake data from the Global Dietary Database, the first database of consumption estimates for major food categories by country, age, and sex. We combined these data with national per capita GDP and food price data. We estimated intake responsiveness to income and prices for each food category, accounting for differences by national income, world region, age, and sex.
Results We identified several differences in intake responsiveness. For example, rising income was estimated to increase milk intake most strongly in Sub-Saharan Africa and fruit intake most strongly among older women globally. Comparing our intake results to previous findings based on expenditure data, we found more goods that exhibited declining intake in response to rising incomes, fewer significant relationships for a number of food categories, particularly for higher income regions, and whereas in prior studies, elasticities mostly decrease with national income, we identified food categories where this was not the case.
Conclusion The results of this study show heterogeneous associations among income, prices, and food intakes. Policymakers should consider the price and income elasticities of certain foods, as well as the role of demographics within and across countries, as they address global nutrition and health challenges.
- Health Economics
- Nutrition
- Health Policy
This is an Open Access article distributed in accordance with the Creative Commons Attribution Non Commercial (CC BY-NC 4.0) license, which permits others to distribute, remix, adapt, build upon this work non-commercially, and license their derivative works on different terms, provided the original work is properly cited and the use is non-commercial. See: http://creativecommons.org/licenses/by-nc/4.0/
Statistics from Altmetric.com
Key questions
What is already known about this topic?
It is generally understood that affordability is an important driver of food demand, underscoring the importance of income and prices in dietary choices.
However, estimates of food-choice responsiveness to income and price (or elasticities) by age and sex have been limited to a single country or a select group of countries.
Research with a global focus mostly uses food expenditure data or national food availability estimates based on agricultural production, exports, and imports.
Such findings may be limited by differences between national food availability data and actual dietary consumption.
What are the new findings?
Our data on dietary intakes for 11 food categories permit evaluation of food consumption that may be notably more accurate than national availability estimates based on agricultural production, exports, and imports.
For the first time to our knowledge, we derive and compare global elasticities by age and sex, characteristics which have been identified as likely to influence different dietary choices in response to income or prices.
We identify several differences and similarities in intake responsiveness, by food category, world region, age, and sex.
Recommendations for policy
Several of the observed relationships appear to represent deeper preferences for specific foods, which can assist policymakers as they consider how economic incentives linked to income and price can be leveraged to tackle nutrition and health challenges. These findings can help inform strategies that counter worsening diets associated with economic development and make food prices reflect the total health and societal costs of food intake.
Introduction
The impact of poor diet on health is a defining global issue of our time. While undernutrition continues to harm disadvantaged populations, obesity, type two diabetes, and other noncommunicable chronic diseases (NCDs) are rising worldwide due to transformations in eating habits.1 2 Most NCDs, including premature adult deaths, occur in developing countries: for instance, the probability of dying from any major NCD between age 30–70 is 60% in developing countries but 10% in developed countries.3 NCDs also pose tremendous economic challenges, particularly in developing countries where they negatively affect economic growth and development potential. This is especially true for rapidly growing economies such as China and India, but also for least developed countries experiencing rising NCD risks and deaths.4 For low-income countries, the annual economic loss due to NCDs is approximately $500 billion, or 4% of their total gross domestic product in 2010.3 In developed countries, the costs are high as well; US estimates of direct medical costs of NCDs are $200−$500 billion annually, placing enormous strain on public budgets and tax bases.5 6
To address the global rise in obesity and related NCDs, international organisations such as the WHO have recommended income and pricing policies to improve diets.4 Personal income and food prices are key drivers of dietary choices and their effects on dietary consumption may vary by food category, country, age, and sex, with important implications for policy interventions in different nations and population subgroups.7 8 However, there is no global assessment of intake sensitivity to income and food prices by food category, age, and sex. Prior studies with a global focus mostly utilised expenditure data or national food disappearance estimates based on agricultural production, exports, and imports, both of which may differ substantially from actual dietary intakes and do not allow for evaluation of age or sex differences in intake responsiveness.9 10 To address these gaps, we examined how per capita income and food prices jointly relate to dietary intakes for 11 major food categories by age and sex, based on nationally representative intake data for 164 countries.
The relationship between food choice and income (price) is often represented by the income (price) elasticity, defined as the percentage change in intake given a specific percentage change in income (price). There is extensive literature on income and price elasticities of food demand focused on particular demographic subgroups or countries,11 12 as well as global research comparing national income and price elasticities.8 13 However, for the first time to our knowledge, we derive and compare income and price elasticities globally by age and sex, characteristics which have been identified as likely to influence different dietary choices in response to income or prices.
Data and methods
Dietary intake, income, and price data
For our assessment of global dietary behaviour, we utilised the 2010 Global Dietary Database (GDD), a database of intakes (in gram equivalents per day) on 11 food categories for 187 countries. (Appendix A, online; Table S1 see supplementary materials for food category descriptions.) The GDD is based on over 300 dietary nationally-representative surveys of 1.75 million individuals, which are representative of 89 percent of the global adult population. It is the first database to provide estimates of daily consumption levels by food category, country, age (20 to 80 in 5-year intervals), and sex. (The data can be disaggregated by sex/age groups and are nationally representative for each country.) The data are derived using qualitative assessment and quantitative modelling, combining survey information with relevant country-level information, United Nations Food and Agricultural Organisation food balance sheet data, and other data sources on diet such as the WHO Global InfoBase and WHO STEPwise approach to Surveillance (STEPS) database. GDD collection methods, data validation, and findings have been described in detail.9 10 14 15
Supplementary file 1
For income, we used 2010 data on per capita gross domestic product (GDP) from the World Development Indicators, World Bank, with adjustment for purchasing power parity (PPP).16 PPP-adjusted estimates account for differences in both currency values and purchasing power, discounting income differences across countries due to disparities in the price level. This facilitates direct cross-country comparisons, following standardisation to a common currency (in the present work, $US).
For food prices, we used 2011 price level indexes from the International Comparison Program (ICP) of the World Bank, a worldwide statistical initiative that estimates PPPs for use as conversion factors to compare the size and price levels of economies around the world.16 Because publicly available ICP data are limited to price level indexes for broad consumption categories (eg, all food and nonalcoholic beverages combined),17 we obtained detailed food price data through an arrangement with the World Bank ICP working group (data received from the ICP, Development Economics Data Group, October 2, 2015). Since all GDD food categories are not explicitly defined in the ICP data, we chose representative goods for the following categories: beans/legumes, nuts/seeds, sugar-sweetened beverages, and 100% fruit juice. (Appendix A and B, online; Table S1 see supplementary materials for details on corresponding ICP food-price categories.) In our analysis, we examine the 164 countries that have both ICP and GDD data.
For this analysis, we divide the world into six regions: Sub-Saharan Africa (SSA) (45 countries); Latin America/Caribbean (LAC) (30 countries); Former Centrally Planned economies of Central and Eastern Europe and Central Asia (FCP) (27 countries); East Asia/Southeast Asia/Asian Pacific (Asia) (13 countries); Middle East/North Africa/South Asia (MENA/South Asia) (23 countries); and High-Income/Western Countries (HIC) (26 countries), an aggregation of high-income countries in the Western hemisphere, Australia, and New Zealand, with the addition of a few surrounding islands. Average daily intakes across the defined regions are reported in table 1. (Appendix A, online; Table S2 see supplementary materials for additional statistics by region.)
Mean intakes by world region
Model and estimation
To estimate intake demand, we used a semi-log quadratic functional form that has been proven to be consistent with economic theory and rational consumer behaviour.18 Prior studies have used a demand-system approach, primarily due to the adding-up property when using expenditure data (ie, expenditures on all categories ‘add up’ to total expenditures), which results in the error terms being correlated across equations. Since this relationship does not exist with individual intakes, particularly when the correspondence between purchases and intakes is not one to one, we estimated intake demand for each food category separately. (Appendix C, online; see supplementary materials for details.)
Let  represent mean daily intake for subgroup g (g: sex and age) in country C for food category i and let
  represent the price level index for the same food category and country. Let
  and
and  represent real per capita income and the food price level index, respectively, in country C. The following semi-log quadratic model was used to estimate the relationship between intake, income, and prices:
 (1)
(1)
The  terms
terms  are parameters to be estimated and
  is a random error term.
Note that equation (1) allows income and price effects to vary by country based on income level due to the quadratic income term,  , and income-price interaction term
  . Also note that the price term is defined by the price of the ith food category,
  relative to overall food prices,
  . Thus, the model discounts any price differences across countries due to differences in overall food prices and implicitly accounts for the cross-price effects of other foods, although in a very general way. For instance, if fruit prices were the same in two countries, but overall food prices differed, fruit intake would be greater in the country with the higher price level since fruit is relatively cheaper when compared with food overall.
Using equation (1), we estimated one regression per food category using a least-squares procedure that allowed for error correlations among observations from the same country (ie, errors are clustered by country).19 The modelling framework accounted for differences by age and sex by allowing these factors to have a direct effect on food intake, as well as an indirect effect through income and price. To account for differences in preferences across countries due to cultural differences or other related factors, we included binary variables by region (SSA, LAC, FCP, Asia, MENA/South Asia, and HIC). Recognising that our defined regions may not completely represent behaviour across countries within a region, we performed a sensitivity analysis by removing high-income Asian countries from Asia, South Asian countries from MENA/South Asia, and small islands from HIC, and specifying these regions separately. Overall, we found no significant difference in the income and price estimates. (Appendix C, online; estimates are reported in the supplementary materials.)
Results
Elasticity estimates across regions
Figure 1 shows the average income elasticities (top panel) and own-price elasticities (bottom panel) by food category and region, ordered by the magnitude of responsiveness in HIC. (We split the six regions for ease of distinguishing the results.) These elasticities were derived using mean intakes from table 1, averaged by sex at age 40, which represents the global median (though the GDD mean and median age is 50). (Appendix A, online; Table S3; the elasticities and standard errors are also reported in the supplementary materials.)

Income elasticities (top panel) and own-price elasticities (bottom panel) by food category and region. Elasticity estimates are averaged across sexes and shown for age 40. Food categories are ordered based on the magnitude of the elasticity estimates in the HIC region. The y-axes are bounded to better highlight the relationship across food categories and regions. Estimates and standard errors are reported online in table S3 in the supplementary materials. FCP = Former Centrally Planned economies of Central and Eastern Europe and Central Asia. MENA = Middle East and North Africa.
For the 11 food categories, the income elasticities display a consistent pattern across regions, ranging from −1.9 (p<0.05) for nuts/seeds in HIC to 0.8 (p<0.01) for fruit juice in SSA (estimates are in response to a 1% increase in income or price, unless otherwise noted). On average, the income elasticities for SSA were larger than other regions. For instance, the SSA income elasticity for processed meat 0.4 (p<0.01) was eight times larger than the next largest significant estimate of 0.05 (p<0.10) (LAC and FCP). SSA was also the only region for which the sugar-sweetened beverage income elasticity 0.2 (p<0.01) was statistically significant. Overall, the results suggested that nuts/seeds and beans/legumes were inferior goods (defined as goods that exhibit declining intake in response to rising incomes) in almost all regions; fruit, unprocessed red meat, and fruit juice intake exhibited the largest positive responses to rising incomes globally.
The own-price elasticities, which are negative given the inverse relationship between intake and own-price, displayed relatively weaker patterns. No particular region stood out as being more sensitive to food prices. Intakes in HIC, however, were the least sensitive to price. In fact, the HIC own-price elasticities were mostly insignificant; fish −0.5 (p<0.05), sugar-sweetened beverages −0.4 (p<0.05), and milk −0.3 (p<0.10) were noted exceptions. Although SSA is the lowest income region on average, its intakes were not the most price sensitive overall, with the exceptions of fruit −0.9 (p<0.05) and fruit juice −1.3 (p<0.01). Overall, the most price sensitive categories were whole grains, fruit juice, fish, and processed meat. For the plant-based categories, the own-price elasticities were all insignificant for vegetables, beans/legumes, and nuts/seeds, but were significant for fruit and whole grains in the lower income regions (SSA, LAC, and FCP).
Elasticity estimates across regions by age and sex
The income and own-price elasticities (by region and sex, for ages 20 and 80) are reported in table 2 and table 3, respectively. (The age groups were chosen to illustrate results for younger and older individuals; estimates for other groups often fell in between these estimates.) In this section, we highlight only those estimates with apparent age and sex differences.
Income elasticity estimates of key food categories by region, sex, and age
Own-price elasticity estimates of key food categories by region, sex, and age
Overall, differences in income elasticity estimates (table 2) were mostly due to food category and region, but in some instances, the estimates differed in magnitude and significance across demographic groups within regions (particularly for fruit, processed meat, and sugar-sweetened beverages). Fruit intake increased with rising incomes across all demographic groups and regions; for instance, a 10% increase in income resulted in a 3% increase in intake for older women in SSA and a 1% increase for young men in LAC and FCP and young women in Asia and HIC. Within regions, fruit intake by older women was consistently most responsive to changes in income, while that of young men was least responsive and, in some instances (HIC, MENA/South Asia, Asia), virtually nonresponsive. Processed meat intake was mostly nonresponsive to income with SSA being a noted exception. In SSA, processed meat intake by young men increased most significantly (by 5% given a 10% increase in income) compared with those of young women (by 4%), older men (by 3%), and older women (statistically nonresponsive). The sex and age estimates for sugar-sweetened beverage intake in Asia and HIC indicated that this food category becomes increasingly more inferior with age. For both older men and women, sugar-sweetened beverage intake decreased by about 2% in Asia and 3% in HIC given a 10% increase in income, whereas intake by young men and women was not responsive.
Similar to the income elasticities, the own-price elasticity estimates (table 3) mostly differed by regions and food category, but were, for the most part, consistent across age and sex subgroups. Exceptions include whole grains in SSA and HIC, processed meat in SSA and Asia, and sugar-sweetened beverages, for which estimates differed by age more than sex. Given the standard errors of these estimates, however, observed differences were not substantial. The largest differences in own-price responsiveness by age were observed for sugar-sweetened beverages, where intake by older adults was more responsive than that of young adults. Globally, the price sensitivity of sugar-sweetened beverage intake varied widely, from a relatively low response of −0.18 (p<0.01) among younger men and women in LAC, to a high of −1.61 (p<0.01) among older men in FCP.
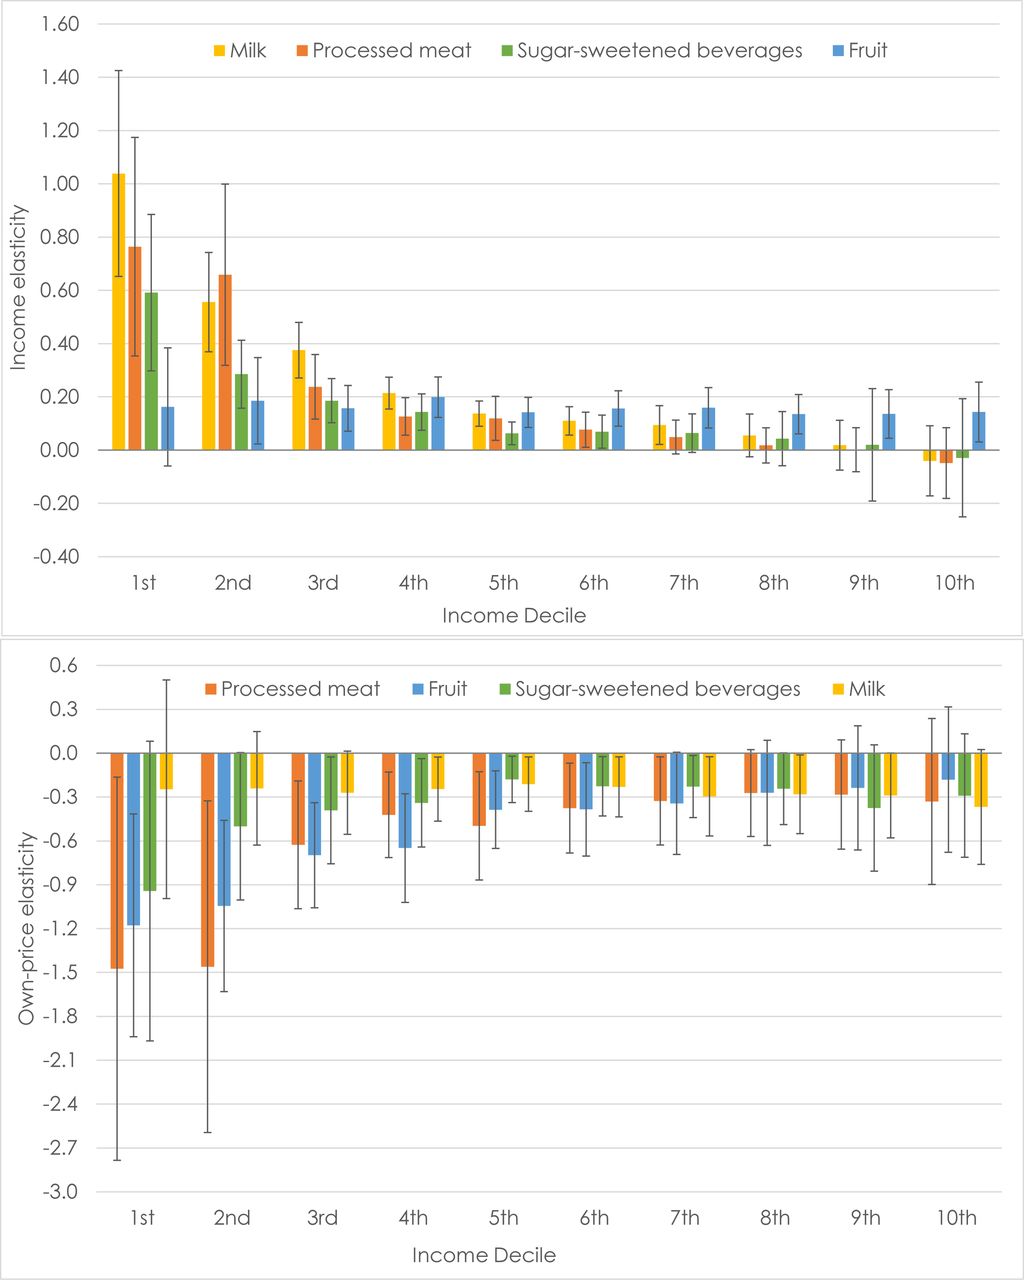
Income and price elasticities across income deciles
Since differences in elasticities across regions may be partly due to differences in regional income, we evaluated the income and price elasticities of dietary intakes of selected foods across countries by deciles of PPP-adjusted per capita income (figure 2). As might be expected, income elasticities were generally largest in countries in the lowest income decile (mean per capita annual income: $1,079). Across food categories, after accounting for differences in price, milk intake appeared most responsive to income in the lowest income nations (10% higher intake from a 10% increase in income), followed by processed meat (8%) and sugar-sweetened beverages (6%). As national income increased, income sensitivity declined and was mostly insignificant by the eighth decile (mean per capita annual income: $24,500). Fruit intake was an exception to this pattern, with generally similar income elasticities across all income deciles (figure 2, top panel).

Income elasticities (top panel) and own-price elasticities (bottom panel) for select food categories by income decile. Elasticity estimates are averaged across sexes and shown for age 40. Each income decile is composed of 16 countries (except the four lowest deciles, which are composed of 17 countries each). The PPP-adjusted income deciles (in thousand $US) are as follows: (1st) $0.6-$1.5, (2nd) $1.5-$2.7, (3rd) $2.7-$5.3, (4th) $5.5-$8.0, (5th) $8.3-$10.8, (6th) $11.1-$15.2, (7th) $15.3-$20.3, (8th) $20.6-$29.4, (9th) $30.4-$40.9, and (10th) $41.3-$127.2. Error bars represent 95% confidence intervals.
Similarly, price elasticities were largest for countries in the lowest income decile for most groups (figure 2, bottom panel). Among the poorest countries, processed meat and fruit appeared most responsive to price (−1.5 and −1.2, respectively), followed by sugar-sweetened beverages (−0.9); and as national income increased, price sensitivity declined. In contrast, milk intake had relatively lower price sensitivity, but was significant across most income deciles.
Discussion
This investigation provides evidence, for the first time to our knowledge, on how differences in personal income and food prices might jointly influence dietary intakes of key foods among men and women of diverse ages across both rich and poor countries. We found that income elasticities commonly varied by food category, region, age, and sex; in some cases considerably so, and in other instances, much less. For instance, an increase in income was estimated to increase fruit intake most strongly in SSA and globally in older women compared with younger men, and to increase processed meat intake in young men in SSA, but less so or not at all in older adults, women, or in other regions. Other foods (eg, red meat and fruit juice) had more consistent positive income elasticities across regions, ages, and sexes. We also identified evidence that intake of some food categories actually declines with rising income in certain regions and for certain demographic groups, such as beans/legumes in MENA/South Asia, Asia, and HIC, especially among older adults, and sugar-sweetened beverages among older adults in richer regions.
We identified evidence of varying influence of price on food intake. This included price sensitivity for fruits and whole grains in certain regions (eg, SSA, LAC, and FCP), but not others (eg, MENA/South Asia and HIC); small price sensitivity for vegetables, beans/legumes, nuts/seeds, and unprocessed red meat, with relatively higher sensitivity in young adults for unprocessed red meat; and consistent price sensitivity for fish globally. Among beverages, milk and fruit juice intake appeared consistently price responsive, with generally strongest effects in Asia; except for fruit juice in HIC which showed little price responsiveness. Sugar-sweetened beverage intake was price sensitive but highly variable, with the weakest effects among younger adults in LAC. Finally we found that most foods were less responsive to both income and price as national income increased, except for fruits and milk, which were also responsive at higher national income.
How do our findings compare to previous studies? Given the level of aggregation in prior studies, exact comparisons are not straightforward. We do find important similarities, however, even though many prior studies used expenditure or disappearance data. For instance, the relative higher responsiveness of SSA and lower income countries to income changes is consistent with previous findings.8 13 But overall, our income elasticities are lower on average, particularly for high-income countries. This may reflect that at higher income levels, an increase in income results in increased demand for quality rather than quantity. Own-price elasticities are more comparable for some groups. For instance, our estimates for fish (−0.4 to −1.0) generally fall within the confidence intervals reported in prior studies.11 12 The main differences in results are that (1) we found more goods that exhibited declining intake in response to rising incomes (ie, inferior goods), (2) we found fewer statistically significant relationships for a large number of food categories, particularly in higher income regions, and (3) whereas in prior studies, income and price elasticities mostly decrease with national income, we identified intake categories where this was not the case (eg, fruit intake in response to income changes, and milk intake in response to price changes).
Increasing the affordability of healthful foods has been considered a key strategy for national and international organisations.20 Our findings suggest that increasing income and/or reducing prices would likely increase fruit intake globally, but would have distinct benefits for men and women of all ages and across most countries, with potentially stronger effects of lower prices in certain regions and among younger men, and of higher income among older women. The latter results are consistent with within-country evaluations in which age positively correlates with nutritional knowledge and better diet choices, and in which women are more likely than men to make healthier dietary purchases with additional income.21 22 In contrast to fruits, our results suggest that vegetable intake may not significantly increase with higher incomes, and that intake of some plant-based foods (beans/legumes, nuts/seeds) might actually decrease in some regions. Beans/legumes may plausibly be considered an inferior good in many parts of the world, particular when considered by people as a protein source.
Our findings for nuts/seeds deserve some consideration. Peanuts make up the largest share of global nut availability at 4.5 kg/year/person (almonds, the leading tree nut, contribute only 0.12 kg/year/person).23 Thus, while in Western nations (the leading tree-nut consumers) many consider tree nuts as a relative luxury good, our findings largely reflect global peanut consumption patterns, driven by leading peanut consuming countries such as China, India, Indonesia, Nigeria, and Vietnam.23 In these nations, peanuts may be viewed as a traditional (and inferior) good by the public in contrast to the small amounts of tree nuts consumed in Western countries, which we could not separately evaluate. In other work it has been shown that increases in tree nut consumption positively correlate with education and income in the US.24
Our income-elasticity estimates suggest that income growth is likely to cause an increase in intake of unprocessed red meat globally, and in processed meats in SSA (especially among younger men), with little or no change in plant-based intake, other than fruit, and potential declines in beans/legumes and nuts/seeds (peanuts). While higher income allows for more food purchases, it also worsens certain dietary choices. For example, it is associated with greater demand for food away from home; a greater demand for more convenient, prepared and processed food due to additional time spent working; and a shift toward multi-national food products (considered and marketed as desirable) and away from traditional diets (often viewed as linked to less prestige and prosperity in developing nations).25 In Brazil, for instance, economic growth has coincided with steady trends toward ultra-processed, ready-to-eat foods of low nutritional value and away from minimally processed, plant-based foods.26 Our income-elasticity results suggest that further economic growth and prosperity alone may not improve dietary habits in many nations, and in fact will likely worsen certain aspects of the diet. This is consistent with global analyses of time trends in dietary patterns from 1990 to 2010, a period of general economic growth, which indicate that while middle-income countries modestly increased their intakes of healthful foods, unhealthy foods increased substantially more; whereas in some of the poorest countries, unhealthy foods increased while healthful foods decreased.10 These complex relationships between rising income and dietary habits likely explain, at least in part, the growing epidemics of obesity, diabetes, and other NCDs in many nations.
While all age groups appeared responsive to higher sugar-sweetened beverage prices (eg, as could occur from taxes, like those recently implemented in Mexico, the UK, and South Africa), young adults often appeared less responsive than older adults, especially in Latin America and the Caribbean. These findings imply that such policies could result in smaller effects at younger ages. Thus while relevant reductions might still occur, additional adjunctive strategies will likely be needed to reduce sugar-sweetened beverage intake by younger adults. Conversely, younger adults (and of course adolescents) often have the lowest incomes, which could partly or fully offset any reduced income sensitivity due to age alone.
Our findings highlight the need for combining economic development programs with policy approaches to improve diets. A number of population-based approaches have been found to produce desired outcomes. Some examples are media and educational campaigns aimed at either promoting healthy foods like fruits and vegetables or reducing intake of unhealthy foods high in sodium, sugar, and saturated fats; comprehensive school- and work-based interventions; direct regulation; and taxation of unhealthy foods or subsidies for healthy foods.27–29
Our analysis has several strengths. While relationships between income, prices, and food choice have been studied, combining GDD, World Bank, and ICP data allowed for a global coverage rarely seen in food and nutrition research, allowing for comparisons across individuals in rich and poor countries. Our data on dietary intakes permit evaluation of food consumption that may be notably more accurate than national availability estimates based on agricultural production, exports, and imports,9 and for the first time to our knowledge, allow investigation of global elasticities by age and sex.
Potential limitations should be considered. Dietary intake data are by nature imperfect and may be less accurate in certain regions; we accounted for uncertainty in our modelling, which led to wider confidence intervals and to lower statistical power (making it difficult to detect weaker associations). We modelled average effects and the response of any single individual to differences in price or income may vary. We considered 11 major food categories with available global dietary data; other foods relevant for health could not be considered. We did not evaluate cross-price elasticities for individual foods, although the modelling framework implicitly accounted for the cross-price effect of all other foods in aggregate. Our modelling cannot prove causality of income and price changes on intakes, and thus our findings should be interpreted cautiously when informing interventions and evaluations. Other factors, such as education and nutritional knowledge that were not available globally, may correlate with income and may separately influence diet.30 Educational attainment and income are, however, highly correlated at the national level, and thus the income variable may represent both purchasing power and other affluence-related variables. In this context, our results could be interpreted as the effects of affluence or economic prosperity more generally.
Furthermore, our results are based on cross-sectional analysis and should be interpreted with caution when considering income growth over time. The invariability of price and income across demographic subgroups ignores differences within countries and may have affected results, although we address this issue, in part, with age and sex variable interactions. Results were also affected by the use of representative prices for food categories not explicitly defined in the ICP (beans/legumes, nuts/seeds, sugar-sweetened beverages, and fruit juice). However, we did find evidence of high correlation between sugar and sugar-sweetened beverage prices, and fresh fruit and fruit juice prices for the US. Lastly, our choice of presenting findings by world region does not preclude sub-regional or country-level analysis; there may be important differences across countries that can be explored in future research.
In conclusion, our results provide novel global evidence for relationships of income and food prices with intakes of key food categories by region, age and sex. Several of the observed relationships appear to represent deeper preferences for specific foods, which can assist policymakers as they consider how economic incentives linked to income and price can be leveraged to tackle nutrition and health challenges. These findings can help inform strategies that counter worsening diets that tend to accompany economic development and make food prices reflect the total health and societal costs of food intake.
References
Footnotes
Contributors AM and DM conceptualized the study. AM was responsible for the study design and model estimations, and contributed to the interpretation of results. AD contributed to the interpretation of results and was a primary author, contributing to the results section and discussion. BM was primarily responsible for the literature review and facilitated the data agreement with the International Comparison Program, World Bank. RM wrote and edited sections describing the intake data. DM provided the intake data and contributed to editing previous drafts. DM obtained the funding. AM was the primary author, but all authors contributed to writing the manuscript.
Funding The Bill & Melinda Gates Foundation (project: Global Dietary Habits among Women, Price and Income Elasticities, and Validity of FoodBalance Sheets) and USDA, Economic Research Service cooperative agreement #58-300-4-0030 (project: Food Security, Nutrition and Dietary Patterns).
Disclaimer The views expressed are those of the authors, and may not be attributed to the Economic Research Service or the U.S. Department of Agriculture.
Competing interests None declared.
Provenance and peer review Not commissioned; externally peer reviewed.