Article Text

Abstract
Background Setting Millennium Development Goals and Sustainable Development Goals for health has largely focused on defining specific targets of mortality and morbidity reduction over given time periods. Yet, less attention has been devoted to setting targets for the systemic determinants of health delivery, such as access and financial risk protection (FRP)—prevention of medical impoverishment. We examined candidate targets for FRP among low and middle-income countries by 2040.
Methods We used a data set on estimates of incidence of catastrophic health expenditure (CHE)—medical expenditure exceeding 40% of household capacity to pay—among 110 countries over 1995–2007, augmented by estimates of the percentage of out-of-pocket expenditure out of total health expenditure (OOPEXP), the share of health expenditure as a percentage of gross domestic product (HEXGDP) and the gross domestic product per capita (GDPC). Using a simple model and 2040 estimates for OOPEXP, HEXGDP and GDPC from the World Bank, the International Monetary Fund and the Institute for Health Metrics and Evaluation, we projected CHE incidence by 2040 for four country income groups.
Results We predicted that the 2040 incidence of CHE among households would be: 2.13% (Uncertainty interval: 0.60-6.87) among low-income countries, 1.15% (0.32–3.81) among lower-middle-income countries and 0.65% (0.18–2.21) among upper-middle-income countries. By 2040, the probability of achieving CHE <1.00% would be: 0.1 for low-income countries, 0.4 for lower-middle-income countries and 0.7 for upper-middle-income countries; for CHE <0.50% , it would be 0 for low-income countries, 0.1 for lower-middle-income countries and 0.3 for upper-middle-income countries.
Conclusions Historical trends of CHE rates can help define post-2015 targets for FRP. The projected achievements suggest that elimination of medical impoverishment will not be achieved by 2040 and that countries must urgently enact dramatic changes in policy to ensure FRP to their populations.
- Sustainable Development Goals
- financial risk protection
- out-of-pocket costs
- poverty
- equity
- low and middle-income countries
This is an Open Access article distributed in accordance with the terms of the Creative Commons Attribution (CC BY 4.0) license, which permits others to distribute, remix, adapt and build upon this work, for commercial use, provided the original work is properly cited. See: http://creativecommons.org/licenses/by/4.0/
Statistics from Altmetric.com
- Sustainable Development Goals
- financial risk protection
- out-of-pocket costs
- poverty
- equity
- low and middle-income countries
Key questions
What is already known about this topic?
The Sustainable Development Goal for health (SDG3), ‘to ensure healthy lives and promote well-being for all at all ages,’ includes a subtarget on achieving ‘universal health coverage, including financial risk protection and access to quality, essential health services.’
There has been little attention until recently to establishing an empirical basis for the measurement, tracking and setting of appropriate SDG targets for financial risk protection (FRP)—prevention of medical impoverishment—based on what might be possible to achieve in the future.
What are the new findings?
We studied, as our measure of lack of FRP, observed past rates of catastrophic health expenditure—out-of-pocket medical expenditure exceeding 40% of household capacity to pay—and their determinants among countries over past times.
We estimated the incidence of catastrophic health expenditure by country income group based on trajectories of health spending and financing, and subsequently tested candidate targets for FRP by the year 2040.
Historical trends of catastrophic health expenditure rates can help define post-2015 targets for FRP. The projected achievements suggest that elimination of medical impoverishment would not be achieved by 2040.
Introduction
The need to measure progress in health has been particularly apparent in relation to assessing whether countries are on track to achieve the Millennium Development Goals (MDGs).1–3 Measuring progress will also be crucial in determining whether countries can achieve the Sustainable Development Goals (SDGs)4 which were ratified by United Nations member states in September 2015 at the General Assembly in New York. The SDG for health (SDG3) is to ‘ensure healthy lives and promote well-being for all at all ages.’5 SDG3 also includes a subtarget (3.8) on achieving ‘universal health coverage, including financial risk protection and access to quality, essential health services.5
An important contribution of the universal health coverage (UHC) discussion is its focus on health-related financial burdens, particularly those due to payment for health services. One policy lever for reducing financial burden on families is to increase the proportion of prepayment (eg, social insurance, tax-based financing) and reducing out-of-pocket (OOP) financing in national health spending.6 Prepayment mechanisms and public finance may also lead to more efficient attainment of desired health outcomes.7
Attention to financial risk protection (FRP)—prevention of medical impoverishment—has grown in recent years as studies have found that OOP medical costs are a leading cause of impoverishment in many countries, and cross-country data have confirmed that high OOP health payments, often in the order of 40% and above of total health expenditure, increase risk of poverty.8 9 Expanding healthcare without FRP is not sustainable. Often, households choose from among several coping strategies in order to manage health-related expenses. When current income or savings are not sufficient, some resort to borrowing money or selling assets to pay for healthcare.10 Household medical expenditure can often be ‘catastrophic’11 12—defined as exceeding a certain fraction of total household expenditure or income.
While UHC has been extensively promoted in the past 5 years, there has been little attention until recently to establishing an empirical basis for the measurement, tracking and setting of appropriate targets for one of its essential components: FRP.6 13–17 One repeated statement has been that no households should face catastrophic medical expenditure from OOP payments,16 an aspiration which has been taken up in several global health areas such as tuberculosis (TB) (‘0% families facing catastrophic costs due to TB’)18 or surgery (‘100% protection against impoverishment from out-of-pocket payments for surgical and anaesthesia care’).19
Importantly, the WHO and the World Bank (WB) in their 2015 progress report towards UHC17 proposed to monitor the lack of FRP by two common indicators: the incidence of catastrophic health expenditure (CHE)—the proportion of households whose health expenditure is greater than a given threshold of total expenditure; and the incidence of impoverishment—the proportion of households pushed below the poverty line because of health expenditure. The WHO/WB report also included estimates on levels and trends of CHE for 37 countries over 2002–2012.17 This major effort, combined with a large mobilisation from the international and academic community, has led to refining the FRP measure within the SDGs20 with the inclusion of indicator 3.8.2: ‘lack of financial protection – proportion of the population with large household expenditure on health as a share of total household expenditure or income21
To the best of our knowledge, there has been no official SDG discussion on what could be FRP targets based on what might be possible to achieve in the future. In this respect, studying observed past rates of CHE—OOP medical expenditure exceeding 40% of household capacity to pay—and their determinants among countries over recent times might prove helpful in testing the feasibility of a proposal for a FRP target in the post-2015 agenda and enhancing accountability towards UHC while building on the WHO/WB framework. Hence, in this paper, we estimated the incidence of CHE by country income group based on trajectories of health spending and financing, and subsequently tested candidate targets for FRP by the year 2040 (a year for which estimated spending and financing data were available), relying on empirical and estimated data and using a rudimentary modelling approach.
Methods
We chose the incidence of CHE, which is the percentage of households experiencing OOP medical expenditure greater than 40% of their capacity to pay, as defined by the WHO,6 as our measure of lack of FRP. Incidence of CHE was selected as our ‘dependent variable’ as readily useable estimates of CHE have been well documented and published for more than a hundred countries over 1995–2007,9 22 which we used in our analysis.
Two key determinants of the incidence of CHE at the country level identified by the seminal Xu and colleagues’ analysis8 were the percentage of OOP expenditure as of the total health expenditure and the percentage of health expenditure as a share of gross domestic product (GDP), which we denoted OOPEXP and HEXGDP, respectively. We used OOPEXP and HEXGDP estimates as given by the WB23 for the time period 1995–2013 and as forecasted by the Institute for Health Metrics and Evaluation (IHME) and the WB24 for the year 2040. We also added GDP per capita, which we denoted GDPC. Wealthier countries offer more extensive healthcare services and their citizens have more resources to invest in health.
The list of all countries retained for the analysis is given in online supplementary appendix S1. Among the 179 countries, 32 were low income, 45 were lower middle income, 51 were upper middle income and 51 were high income, according to the WB’s income group classification.23
First, following previous approaches,8 9 we estimated a simple model relating CHE to its key determinants of OOPEXP, HEXGDP and GDPC in the following way:
 (1)
(1)
where  is a country random effect capturing heterogeneity and variations between countries and studies and
  is an error term. A number of alternative model specifications could be tried and are discussed in online supplementary appendix S1. However, model (1) was retained for simplicity as data for OOPEXP, HEXGDP and GDPC (and not for other predictors) were readily available annually over 1995–2013, and recent estimates for OOPEXP and HEXGDP were available for the single year 2040.24
Second, OOPEXP and HEXGDP estimates were available for both the year 201323 and the year 204024; and GDPC estimates were available for the year 2013.23 As for GDPC estimates for 2040, from the projections for the years 2015–2021 from the International Monetary Fund,25 we calculated the annualised rates of change (in % per year) in GDPC for low-income, lower-middle-income, upper-middle-income and high-income countries. Subsequently, we used such annualised rates of change to predict what would be GDPC, for each country, depending on their income group, for 2040. Using the 2040 values of GDPC, OOPEXP and HEXGDP in equation (1), we could estimate a predicted incidence of CHE by 2040 for each country, which was then aggregated per income group by arithmetic average.
Third, we compared our estimated 2040 incidence of CHE per income group to four candidate targets: (1) <0.50% ; and three other targets, that is, (2) <1.00%; (3) <1.50%; and (4) <2.00%. To judge whether such targets might be realistic under current trends, we estimated the probability that each income group (low income; lower middle income; upper middle income) would have achieved them by 2040, according to our predictions.
Uncertainty analysis
We pursued a probabilistic sensitivity analysis. For each income group (low income, lower middle income, upper middle income, high income), we pursued Monte Carlo simulations (n=100,000 trials) capturing both parameter uncertainty in the inputs (OOPEXP, HEXGDP, GDPc) and estimation uncertainty in the model. Parameter uncertainty was included through sampling n values for OOPEXP and HEXGDP parameters to which was assigned a beta distribution built on each input’s mean and uncertainty interval,24 and for the growth rate of GDPc per income group to which was assigned a gamma distribution built on mean and SD.25 The estimation uncertainty was included through sampling n values for each combination of the model coefficients extracted from a multivariate Gaussian distribution using mean and variance-covariance matrices from the fitted model (1). Both parameter uncertainty and estimation uncertainty were varied simultaneously, resulting in n samples for each country CHE incidence. Through aggregation (arithmetic average) of country results within each income group, we again obtained n samples for CHE. Finally, extracting the 2.5 and 97.5 percentiles allowed the determination of 95% uncertainty intervals (UIs), which we reported along our results.
All analyses were conducted with the R statistical software version 3.3.1 (www.r-project.org).
Results
We first report on the findings from model (1), where we observed that: for a relative reduction of 10% in the odds of OOPEXP we obtained a relative reduction of 7% in the odds of CHE; for a relative increase of 10% in the odds of HEXGDP, we obtained a relative increase of 7% in the odds of CHE; and for a relative increase of 10% in GDPC, we obtained a relative decrease of 4% in the odds of CHE (table 1).
Results for the predictors of logit of incidence of catastrophic health expenditure as a function of the percentage of OOPEXP, the percentage of HEXGDP and the GDPC
While examining the trends in GDPC over 2015–2021, we calculated annual rates of change of 4.5% (SD 2.9%) for low-income countries, 4.5% (SD 2.7%) for lower-middle-income countries, 4.1% (SD 2.4%) for upper-middle-income countries and 3.4% (SD 2.0%) for high-income countries.
With these inputs, we predicted the incidence of CHE among households in 2040 for each income group classification (figure 1). Estimated CHE would be: 2.13% (UI: 0.60-6.87)for low-income countries, 1.15% (0.32-3.81) for lower-middle-income countries, 0.65% (0.18-2.21) for upper-middle-income countries and 0.40% (0.11-1.39) for high-income countries. We also quantified the annualised rate of decline in the incidence of CHE over 2013–2040 (figure 2), which would be of: 1.3% (UI: −0.4% to 4.7%) per year for low-income countries, 1.7% (0.2%–4.8%) for lower-middle-income countries and 1.5% (0.0%–4.2%) for upper-middle-income countries.

Estimated incidence and corresponding uncertainty ranges of catastrophic health expenditure among low-income (red), lower-middle-income (purple), upper-middle-income (blue) and high-income (black) countries in 2013 and 2040.

Distribution of the estimated annualised rate of decline over 2013–2040 of the incidence of catastrophic health expenditure among low-income (red), lower-middle-income (purple) and upper-middle-income (blue) countries.
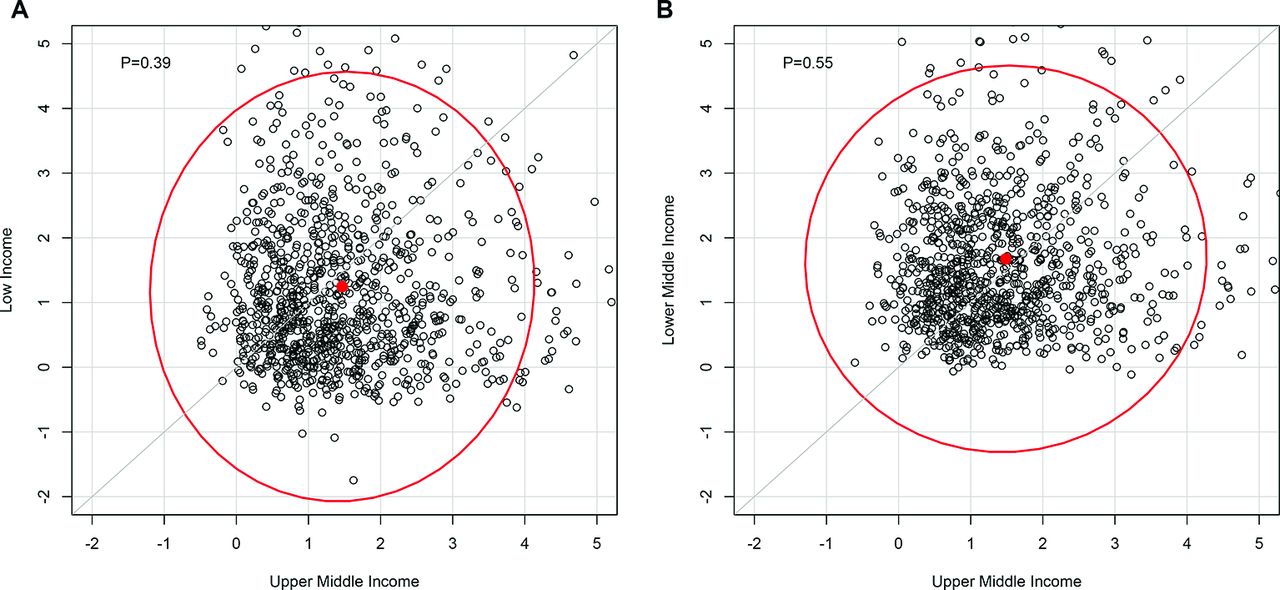
Furthermore, we studied how the gaps in CHE incidence across income groups would evolve over 2013–2040 by examining whether the annualised rates of decline in CHE incidence (n=100,000) of the low-income and lower-middle-income countries group would be greater than those of the upper-middle-income countries group over the same time period (figure 3A,B). Notably, we found that low-income countries (probability of 0.39), compared with lower-middle-income countries (probability of 0.55), would be unlikely to reduce the gap with upper-middle-income countries.
Rates of decline of incidence in catastrophic health expenditure over 2013–2040 of low-income (A) and lower-middle-income (B) countries (y-axis) compared with the rates of decline of upper-middle-income countries (x-axis) (n=1000 trials extracted from Monte Carlo simulations). A dot above the grey line indicates that the rate of decline of the income group is greater than the rate of decline of upper-middle-income countries; the corresponding probability is indicated in the top left corner and the 95% uncertainty contours in red.
No low-income countries would achieve CHE <0.50% by 2040 (table 2); the probability for lower-middle-income countries would be less than 0.10; the probability for upper-middle-income countries would be about 0.31. With a CHE target <1.0%, the probability for low-income countries would be 0.11, 0.39 for lower-middle-income countries and 0.74 for upper-middle-income countries. With a CHE target <1.5%, it would be: 0.27 for low-income countries, 0.65 for lower-middle-income countries and 0.90 for upper-middle-income countries.
Probability (n=100,000 trials from Monte Carlo simulations) that country groups achieve specific financial risk protection targets of estimated incidence of CHE by 2040. Financial risk protection targets are: CHE <0.50%; CHE <1.00%; CHE <1.50%; and CHE <2.00%.
Discussion
We presented in this paper estimates of the incidence of CHE in 2040 per country income group using readily available data and a simple modelling approach.
As identified previously,8–10 15 our analysis confirms the percentage of OOP expenditure out of total health expenditure (OOPEXP) as the main driver of CHE. According to our predictions, in 2040, the estimated incidence of CHE among households would be 2.13% (UI: 0.60-6.87) among low-income countries, 1.15% (0.31-3.81) among lower-middle-income countries and 0.65% (0.18-2.21) among upper-middle-income countries. The estimated relative reduction in CHE incidence over 2013–2040 would be of about 29% among low-income countries, 37% among lower-middle-income countries and 33% among upper-middle-income countries. This suggests that forecasts in financing policy would be supportive of FRP.
One purpose of our analysis is to help define what might be a feasible post-2015 target for FRP in health. In this respect, we found that, by 2040, the probability of achieving CHE <0.50% would be 0 for low-income countries, less than 0.10 for lower-middle-income countries and 0.31 for upper-middle-income countries. By contrast, with CHE <1.00%, it would be: 0.11 for low-income countries, 0.39 for lower-middle-income countries and 0.74 for upper-middle-income countries. While 0.50% and 1.0% both appear as low numbers, they translate into hundreds of thousands of people who are at risk of impoverishment if the reduction in OOP payments is not dramatically accelerated (1% of households correspond to about 2 500 000 families in India, 600 000 in Brazil and Indonesia, and 160 000 in Ethiopia, for example).
Our study has four key limitations. First and foremost, we relied on older CHE estimates9 22 which cover a time period over 1995–2007 and about a hundred and ten countries from all income levels. This points to the critical need that OOP health payments data be collected and reported routinely. New data on OOP payments are urgently needed and would be an important public good to support the global campaign for UHC. In this regard, the WHO/WB UHC tracking report17 critically provides directions and points to the limitations of past efforts including reliability and comparability across household expenditure surveys,26–28 and the needs for strengthening data availability and comparability in the future and for additional data notably on the long-term impact of household OOP payments and the distribution of those over time.29 Second, our modelling strategy was basic. More sophisticated approaches could have been used to forecast the changes in CHE incidence, and predict which countries would achieve distinct FRP targets by 2040. Here, we opted for a rudimentary approach consistent with previous work,8 9 which was readily applicable with underlying data (notably the available estimates for HEXGDP and OOPEXP for the year 204024 and easily communicable to policymakers). Third, our study uniquely considered CHE, defined as medical expenditure exceeding 40% of household capacity to pay, as measure of (lack of) FRP. This measure was proposed as an indicator for monitoring progress towards UHC at country and global levels16 17: it is an indicator with which decision makers are familiar and for which data were readily available for analysis,9 22 hence our decision to use it in this study. Yet, the CHE metric presents a number of associated issues, most importantly the use of a defined threshold (ie, 40% of capacity to pay).11 Other metrics could be used such as impoverishing expenditure (eg, defined as medical expenditure pushing households under an absolute or relative poverty line), or forced borrowing or asset selling to finance medical expenditure.10–12 In addition, current CHE measures do not account for individuals who fail to obtain needed healthcare due to their inability to pay and thus are likely to underestimate financial burdens of illness. Finally, in Xu and colleagues9 three key determinants of high CHE were identified: high availability of health services, poverty and lack of prepayment mechanisms. Since countries differ substantially with respect to all three factors, their trajectory is extremely hard to predict. Due to data limitations, our model did not separate the availability of health services and shift towards prepayment mechanisms that accompanies income growth. If future expansion of health services availability is more rapid than the shift towards prepayments, CHE may well increase with economic growth. If we take into consideration the relative lack of adequate data, uncertainty and the dynamic interaction between these key determinants, we may conclude that lower CHE targets are more realistic, but still aspirational.
Protection from financial risks associated with healthcare expenses is a crucial component of national health strategies in many countries. From an ethical perspective, the loss of well-being from being pushed into poverty by health expenditure is no less devastating than the loss of health due to illness.30 Moving towards UHC is important because it will promote better health and it will protect people from poverty, the need to borrow money or possibly financial ruin. FRP is therefore a key objective for health systems.
This paper shows the reduction in CHE that may occur on current trajectory of health spending and financing policy.24 However, SDGs are aspirational by design. This analysis simply used historical trends and did not model what would result from increased priority to SDGs. Financing instruments including public finance and a higher share of public health expenditure through general taxation and payroll taxes could progressively replace OOP payments and reduce CHE. Countries spending more than 3% of public health expenditure as a share of GDP, as argued by The Lancet Commission on Investing in Health for achieving the ‘grand convergence’ around infectious, child and maternal mortality by 2035,31 often meet OOPEXP under 20%.32 33 Using our model and setting OOPEXP to a cap of 20% (or 15%) by 2040, the estimated incidence of CHE would become 0.86% (0.69) among low-income countries, 0.56% (0.47) among lower-middle-income countries and 0.45% (0.37) among upper-middle-income countries. This shows that large increases in public finance could substantially accelerate attainment of FRP. For instance, Thailand’s universal coverage scheme providing a comprehensive tax-financed benefits package given to the poor and those in the informal sector substantially reduced medical impoverishment since its inception in 2002.34 Likewise, the experience of several other low and middle-income countries suggests that UHC can hasten achievement of FRP.35 For example, through its Health Transformation Programme, Turkey substantially expanded insurance coverage within 10 years.36 With introducing Seguro Popular in 2003, Mexico has expanded access to comprehensive health services with FRP.37 Ethiopia is currently maintaining selected essential services free of charge and rolling out health insurance schemes on its way to UHC (box).
Provision of financial risk protection in Ethiopia
Ethiopia has long recognised that direct out-of-pocket (OOP) payments at the point of care prevent a majority of the population from accessing health services and result in financial hardship for many, and has therefore designed two appropriate strategies: maintaining selected high-impact fee-exempted services for everyone, and risk pooling and prepayment mechanisms.
The first strategy is putting in place a fee exemption for a set of selected high-impact and cost-effective services including vaccinations, in-facility birth services, antiretroviral treatment, tuberculosis treatment, and so on. Such ‘exempted’ essential services organised into the five categories of family health, communicable disease prevention and control, hygiene and environmental health, health education and communication, basic curative care and treatment of chronic conditions, have been provided to all free of charge and will remain so.38
Second, there are two insurance schemes. Social health insurance (SHI) is a compulsory scheme for people in the formal sector where employees and employers contribute to the scheme, and which has about 1.8 million members. Community-based health insurance (CBHI) is a voluntary scheme meant for those in the informal sector and is largely subsidised by the government. It has been successfully scaled up in 200 districts (25% of Ethiopia’s districts).39 The next 5-year health sector plan, the Health Sector Transformation Plan (HSTP), sets 100% coverage for SHI and 80% for CBHI, and puts targets of reducing OOP expenditure from 34% to 15% of total health expenditure by 2020.40 41 The primary objective is to reduce the reliance on direct OOP payments, lower the financial barriers to access and thereby diminish the impoverishing impact. With these two schemes, the level and share of revenues channelled through prepaid and pooled mechanisms will be increased, reducing fragmentation to increase the redistributional capacity of the pooled funds, on the move towards universal coverage. In the long term, the HSTP intends to harmonise the benefits packages of and integrate the two schemes.
To achieve substantial improvements in FRP in the decades ahead, dramatic policy changes need to happen in low and middle-income countries, led by countries and supported by the international community. Thus, our work here should be viewed as a conservative estimate of what the future holds. The purpose of UHC and, indeed of the SDGs, is to change the future.
References
Footnotes
Contributors SV initiated and conceptualised the study. SV coordinated the research and did the analysis with MEK. WND pursued some of the preliminary analyses. SV wrote the first draft of the report. ATW drafted the box. All authors subsequently read, revised and approved the report.
Competing interests None declared.
Provenance and peer review Not commissioned; externally peer reviewed.
Data sharing statement No additional data are available.