Article Text

Abstract
Objectives To examine the impact and cost-effectiveness of user fee exemption by contracting out essential health package services to Christian Health Association of Malawi (CHAM) facilities through service-level agreements (SLAs) to inform policy-making in Malawi.
Methods The analysis was conducted from the government perspective. Financial and service utilisation data were collected for January 2015 through December 2016. The impact of SLAs on utilisation of maternal and child health (MCH) services was examined using propensity score matching and random-effects models. Subsequently, the improved services were converted to quality-adjusted life years (QALYs) gained, using the Lives Saved Tool (LiST), and incremental cost-effectiveness ratios (ICERs) were generated.
Findings Over the 2 years, a total of $1.5 million was disbursed to CHAM facilities through SLAs, equivalent to $1.24 per capita. SLAs were associated with a 13.8%, 13.1%, 19.2% and 9.6% increase in coverage of antenatal visits, postnatal visits, delivery by skilled birth attendants and BCG vaccinations, respectively. This was translated into 434 lives saved (95% CI 355 to 512) or 11 161 QALYs gained (95% CI 9125 to 13 174). The ICER of SLAs was estimated at $134.7/QALYs gained (95% CI $114.1 to $164.7).
Conclusions The cost per QALY gained for SLAs was estimated at $134.7, representing 0.37 of Malawi’s per capita gross domestic product ($363). Thus, MCH services provided with Malawi’s SLAs proved cost-effective. Future refinements of SLAs could introduce pay for performance, revising the price list, streamlining the reporting system and strengthening CHAM facilities’ financial and monitoring management capacity.
- cost-effectiveness
- user fees
- maternal and child health
- health economics
This is an open access article distributed in accordance with the Creative Commons Attribution Non Commercial (CC BY-NC 4.0) license, which permits others to distribute, remix, adapt, build upon this work non-commercially, and license their derivative works on different terms, provided the original work is properly cited, appropriate credit is given, any changes made indicated, and the use is non-commercial. See: http://creativecommons.org/licenses/by-nc/4.0/.
Statistics from Altmetric.com
Key questions
What is already known?
Many low-income and middle-income countries have abolished user fees as a means to encourage the use of essential maternal and child health services.
Impact evaluation of user fees exemption on utilisation of health services provides mixed results, but generally points to the favourable direction of improving the use of health services, particularly for the poor.
There is limited evidence on cost-effectiveness of user fee exemptions available for policy makers to make more informed decision.
What are the new findings?
The user fee exemption, through contracting Christian Health Association of Malawi, has improved the utilisation of antenatal and postnatal visits, delivery by skilled birth attendants and BCG vaccination.
Based on Malawi’s per capita gross domestic product, user fee exemption proved cost-effective in Malawi from the government perspective, with the cost per quality-adjusted life year gained of $134.7.
What do the new findings imply?
This study provides empirical evidence of the cost-effectiveness on the government’s contracting out essential health services to a non-governmental organisation in a resource-limited setting.
Introduction
There have been numerous debates on user fees for delivering health services in low-income and middle-income countries. In the 1980s, due to substantial financial constraints in developing countries to finance health facilities, user fees were introduced as a means to finance health facilities, improve consumption efficiency and rationalise services, known as Bamako Initiative.1 However, user fees posed challenges for the population, particularly the poor, to access care, and few studies demonstrated that user fees were used to increase quality and utilisation of care.2 Driven by the political commitment towards the Millennium Development Goals, in the early 1990s and 2000s some countries started abolishing user fees to encourage the use of essential health services and have pointed to the positive impact of abolishing user fees on the improvement of health services.3
Malawi has a mixed user fee charge system. In public health facilities, health services have been provided for free since 1964. However, a significant share of primary care in Malawi was provided by non-government organisations or the private sector. The Christian Health Association of Malawi (CHAM) is one of key players of Malawian’s health delivery system. CHAM has been and continues to be engaged in providing over 35% of all health services delivered to the people of Malawi. For some primary and secondary health services, CHAM charges user fees, whereas those services would be free in the public sector. Since 2002, the government of Malawi (GOM) and CHAM have worked together to create service-level agreements (SLAs), to expand access to a defined set of free health services through CHAM facilities in geographic catchment areas where no government/public health facilities exist. SLAs aim to expand access by reimbursing CHAM for selected primary health services, and in turn, for CHAM to eliminate user fees for those services. SLAs have been implemented for more than 10 years, starting form 2006, and have been scaled up gradually in Malawi.
Under SLAs, the GOM pays health worker benefits (salaries, leave grants, pension contributions) to eligible CHAM facilities. In return, CHAM manages the facility-based staff, ensures adequate skills and submits expenditure reconciliation statements. Additionally, the GOM has agreed to pay service delivery costs based on SLAs that are negotiated at a district-council or city-council level to deliver essential health package (EHP). CHAM facilities with SLAs should not charge patients to deliver the EHP, which includes about 55 health services for both adults and children. These services consist of prevention and treatment of vaccine-preventable diseases; treatment of common illnesses among children such as respiratory infections, diarrhoea, malnutrition and malaria; maternal and child health (MCH) services and treatment of tuberculosis and HIV/AIDS. These services are regarded as highly cost-effective and critical in addressing the health needs of Malawians.4 The SLA-participating CHAM facilities must submit a monthly invoice detailing the scale and scope of services provided. The actual reimbursements through SLAs cover 70% of the estimated unit cost by interventions, and the remaining 30% is covered primarily by CHAM user charges for services not covered by EHP or funds raised by CHAM headquarters.5
Over the last decade, the GOM has invested substantial resources in contracting with CHAM through SLAs to provide free selected care for populations in remote areas. A recent study shows that SLAs have improved the utilisation of selected MCH services.6 Given the increasing resources used for SLAs, the Ministry of Health (MoH) of Malawi has become increasingly interested in understanding the cost-effectiveness of SLAs. This study aims to provide analytical evidence on cost-effectiveness of contracting CHAM facilities using SLAs in Malawi.
Methods
Overall approach
This cost-effective analysis was conducted from the Malawi government’s perspective, and thus the cost incurred by households and CHAM was excluded from the analysis. Additionally, the cost of salaries for CHAM facilities was excluded from the analysis, as these were routine costs that would be incurred by the government whether SLAs were implemented or not.7
The policy intervention for the analysis is the government’s payment to CHAM health facilities through SLAs to provide free EHP services. SLAs started in the early 2000s, but some facilities stopped SLAs due to delays in payment, as they could not afford to provide services to the population without user fees. In January 2016, most eligible CHAM health facilities signed new SLAs to provide EHP for free to its covered population, and this resumed the government’s financial commitment. However, due to a delay in the administrative process, the implementation of SLAs in many facilities did not begin until July 2016. To evaluate the latest impact and cost-effectiveness of SLAs, we collected the data on cost of SLAs and utilisation of health services from selected health facilities from January 2015 to December 2016, with a total of 24 months. By the time of this analysis, we did not have complete data for 2017, and thus excluded the data in 2017 from the analysis.
The status quo in this study was defined as the scenario where the government had not contracted with CHAM facilities, and CHAM facilities continued providing services by charging user fees when patients sought care in CHAM facilities.
Cost estimation
We obtained a list of CHAM facilities from the CHAM Secretariat and cross-checked with CHAM facilities in Malawi’s health services DHIS-2 database, from which the indicators on utilisation of health services were abstracted. Out of 175 CHAM facilities, 149 CHAM facilities collecting data on SLAs payments were available in DHIS-2. As the cost-effectiveness was conducted from the government perspective, the cost focused on payments from the Government of Malawi to CHAMs through SLAs.
Cost data sources
Given the challenge to obtaining detailed services paid through SLAs for each facility, the costs of SLAs were obtained using a macro-costing approach. We collected aggregate invoiced payments to health facilities from district health offices (DHOs). DHOs were responsible for monitoring the implementation of SLAs, verifying service delivery and processing payments once invoices were submitted.5 To obtain the cost of SLAs from CHAM facilities, a researcher visited both the CHAM Secretariat and CHAM facilities. All CHAM facilities were asked about their SLAs status from January 2015 to December 2016 for each month, and amount of payment or expected payment through SLAs. If facilities did not have the data, we retrieved invoiced amounts from the accounting department at the MoH. Facilities were paid in Malawian Kwacha (MWK), and all the costs were converted to US dollars (USD) based on a mid-year exchange rate (1 US$=496.4 MWK in 2015; 1 US$=713.8 MWK in 2016) when expenses occurred.8
Effectiveness estimation
Selection of health services and data source
Compared with status quo, it is expected that removing user fees by contracting with CHAM through SLAs would improve the coverage of key MCH services that SLAs target. DHIS-2 data were the major data source for estimating the coverage of key MCH services.9 DHIS-2 is a free and open-source software-based data collection, aggregation, management and analysis tool.10 It collects data on both inputs and outputs of health facilities, such as number of various personnel, volume of key health services (ie, number of consultative visits) as well as size of target population, based on which to estimate the coverage of health services. We abstracted data from DHIS-2 on six indicators that included antenatal care (ANC), postnatal care (PNC), delivery by skilled birth attendants (DSBA), BCG vaccine, Pentavalent vaccination and Polio vaccination. These indicators were chosen based on availability, accuracy, feasibility to be modelled and priority in managing illnesses in Malawi.6 11 The definition of each selected indicator is presented in online supplementary appendix 1. Some equally essential health services, such as family planning (FP), were excluded due to lack of data or inability to use Lives Saved Tool (LiST), the software to convert the coverage of health services to the number of lives saved, to model health outcomes.11
Propensity score matching
To examine the impact of SLAs on the selected indicators, we first used a propensity score matching approach12 to match facilities with different SLA statuses in the first month (January 2015) on three factors: type of facility (hospitals, community hospitals and health centres), the number of staff and the size of the catchment population. The three factors were selected because of the availability of the data and use by a prior study.6 The propensity scores were estimated with the Probit model, and then health facilities were matched using the nearest neighbour approach, with 1:1 matching. The Probit model is expressed as

where p is the probability of CHAM facilities under SLAs at the beginning of 2015, facilities is the matrix representing the three types of health facilities, staff represents the number of staff working in health facilities and catchmentpop is the estimated catchment population in each health facility, γs are associated coefficient matrix, and Φ(.) is the cumulative normal density function.
In January 2015, there were 49 facilities with SLAs out of a total of 149 CHAM facilities in the DHIS-2 database, and we selected an additional 49 CHAM facilities without SLAs in January 2015 to match them. Thus, we used 98 CHAM health facilities for the impact evaluation based on 1:1 matching.
Estimation SLAs’ impact on coverage of health services
It should be noted that the SLA status for a health facility was not constant, and it may have changed during the 2-year period 2015–2016. To examine the impact of SLAs on the selected six indicators, we constructed a dataset with 24 month panels and used the following regression model, which is similar to the model used by Manthalu et al to examine the impact of SLAs in their prior study:6

where HScovit is the coverage of health services for ith facility at time t, SLA is the status of health facilities with SLAs or not, αi is the impact of individual health facilities (ie, location, size, specialty or management), εit is the random noise, and βs are coefficients estimated from the regression model. The coverage of health services was estimated using the number of services divided by the estimated target population size. Taking DSBA as an example, its coverage was calculated as the ratio of the number of DSBAs provided in a health facility to the estimated number of pregnant women served by the health facility in a year. We conducted both random-effects and fixed-effects models and reported the results from the random-effects model as the Hausman tests were mostly not statistically significant between the two types of the models. β1 represents the treatment effect of SLAs on the coverage of health services, which was estimated from those facilities that changed their SLA status, while β0 shows the average coverage of health services for health facilities without SLAs. Given the insignificant difference between the random-effects and fixed-effects models, the panel data model also controlled for health facility characteristics that do not change overtime (eg, location), which was captured by  . R program was used to conduct the statistical analysis.
Conversion of SLAs’ impact on coverage of health services to quality-adjusted life years
Once we estimated the impact of SLAs on the coverage of key MCH services using the above regression models, we calculated the coverage of key MCH services with or without SLAs based on the coefficients of SLAs and constants in the regression models and used them as parameters for LiST. The constant represented the average coverage of health services for health facilities without SLAs, while the sum of the coefficient and constant was the estimated average coverage of health services for health facilities with SLAs. The LiST was developed by Johns Hopkins University to estimate the impact of MCH services on mortality and morbidity. The key inputs of LiST tools are demography, cause of death, coverage of maternal and children services, health status and effectiveness estimates for health interventions.11 The effectiveness is primarily based on international literature on maternal and child mortality rates in Malawi, causes of maternal and child deaths, percentage of reduction of deaths due to a specific cause by a particular intervention and percentage of deaths due to a specific cause which are potentially affected by a specific intervention. With these parameters, the LiST was able to translate the change of the coverage of essential MCH services into the number of deaths averted, which could be further converted to a more standard effectiveness measure in the cost-effectiveness analysis—quality-adjusted life years (QALYs) gained. All the parameters used in the LiST were verified by the Child Health Epidemiology Reference Group (CHERG) convened by the WHO,13 to convert the coverage of services to health outcome indicators, such as mortality and morbidity reduction. LiST has been widely applied to estimate the number of lives saved from improved coverage of services.13–17 When implementing LiST, we used key parameters from Malawi preloaded in the tool (eg, the age structure of the population, child and maternal mortality rates, causes of deaths) and adjusted the population size to that of the catchment population in CHAM covered areas.
We then used the average age of pregnant women18 and Malawi-specific life tables19 to convert the number of lives saved to QALYs saved.15 20 21 The average quality of life if one survives was estimated as 0.88 in Malawi.22 The conversion used 3% as the discount rate. An incremental cost-effectiveness ratio (ICER) was then generated. The formula to convert one life saved to QALYs is:15 20

where Q is average quality of life if one survives, r is the discount rate (we applied 3% in the analysis) and La is life expectancy at the age of death of a, estimated from Malawi’s life table. Q was estimated from the disease burden in Malawi as:15

Cost-effectiveness analysis and uncertainty estimation
Based on the payments to SLAs CHAM health facilities and estimated QALYs gained through the improved coverage of health services through SLAs, we estimated the ICER of SLAs, which is expressed as

As LiST does not allow for probabilistic sensitivity analysis, to estimate the uncertainty of ICER, some assumptions had to be imposed. The uncertainty in this study focused on the impact of SLAs on the six indicators. In this study, we assumed the independence of the six indicators and their additive effect on the outcome (death or morality) to simply the analysis. The uncertainty intervals (UI) of each indicator were used to estimate the 95% UI of the ICER. Despite the limitation of assuming independence of the indicators, such an assumption provides a more conservative (wider) estimate of 95% UI.15 The UI level for each indicator was calculated in online supplementary appendix 2.
Threshold of cost-effectiveness analysis
There has been a lot of debate on thresholds of cost-effectiveness analysis,23–25 but to date no consensus has been reached. Jamison et al estimated the value of a life-year as 1.4–4.2 times the gross domestic product (GDP) per capita, averaging 1.6 times the GDP worldwide.26 Based on that study, two recent studies used 1.5 times per capital GDP as the threshold for the cost-effectiveness analysis15 or the value of a healthy life-year in the cost-benefit analysis.14 We also used 1.5 times per capital GDP as the threshold for our study. In 2013, per capita GDP was $363 in Malawi27 and thus the threshold was estimated at $544. Interventions with ICERs smaller than the threshold were regarded as cost-effective.
Patient and public involvement
Neither patients nor the public were involved in the study.
Findings
General characteristics
Figure 1 shows the SLA status for 149 CHAM facilities from January 2015 through December 2016 in the DHIS-2 database. The number of facilities with SLAs was not constant over time. Some facilities stopped SLAs due to financial constraints stemming from delays in receiving payment during the SLA negotiation period, which was concluded in January 2016. Since then, more facilities have implemented SLAs. The number of health facilities with SLAs declined from 49 in January 2015 to 34 in Feb 2016 and then increased gradually to 46 in December 2016.

SLA status of 149 CHAM facilities. CHAM, Christian Health Association of Malawi; SLA, service-level agreement.
The population served by SLA facilities over the 2 years of the study was estimated, on average, at 1.22 million, ranging from 0.84 million in February 2016 to 1.45 million in July and August 2015. The change of the population was primarily due to the change of the number of health facilities implementing SLA. The average population of 1.21 million covered by SLA accounted for 6.7% of the total population in Malawi, which is the population parameter used in the LiST.
After the propensity score matching, the three matching characteristics (type of health facilities, number of staff and catchment population) of the 49 facilities with SLAs were compared with 49 matched facilities without SLAs in January 2015. Table 1 shows the comparison results. In January 2015, there were more hospitals and fewer health centres with SLAs, compared with health facilities without. However, the difference was not statistically significant. The average population size served by each health facility and average number of staff seem higher in SLA CHAM facilities than no-SLA facilities. However, again this was not statistically significant.
Characteristics of 98 matched CHAM facilities
Cost estimation
Over the 2 years of the study 2015–2016), a total of $1.5 million were disbursed to CHAM facilities through SLAs, with an average of $1434 per facility per month ranging from $935 in January 2016 to $1890 December 2016. This was equivalent to an average of $1.24 per capita in the catchment area. Consistent to the pattern of SLA status showed in figure 1, the payment to CHAM facilities through SLAs also declined until February 2016, but increased gradually since then (figure 2) as more and more facilities implemented SLAs with renewed financial commitment from the MoH.
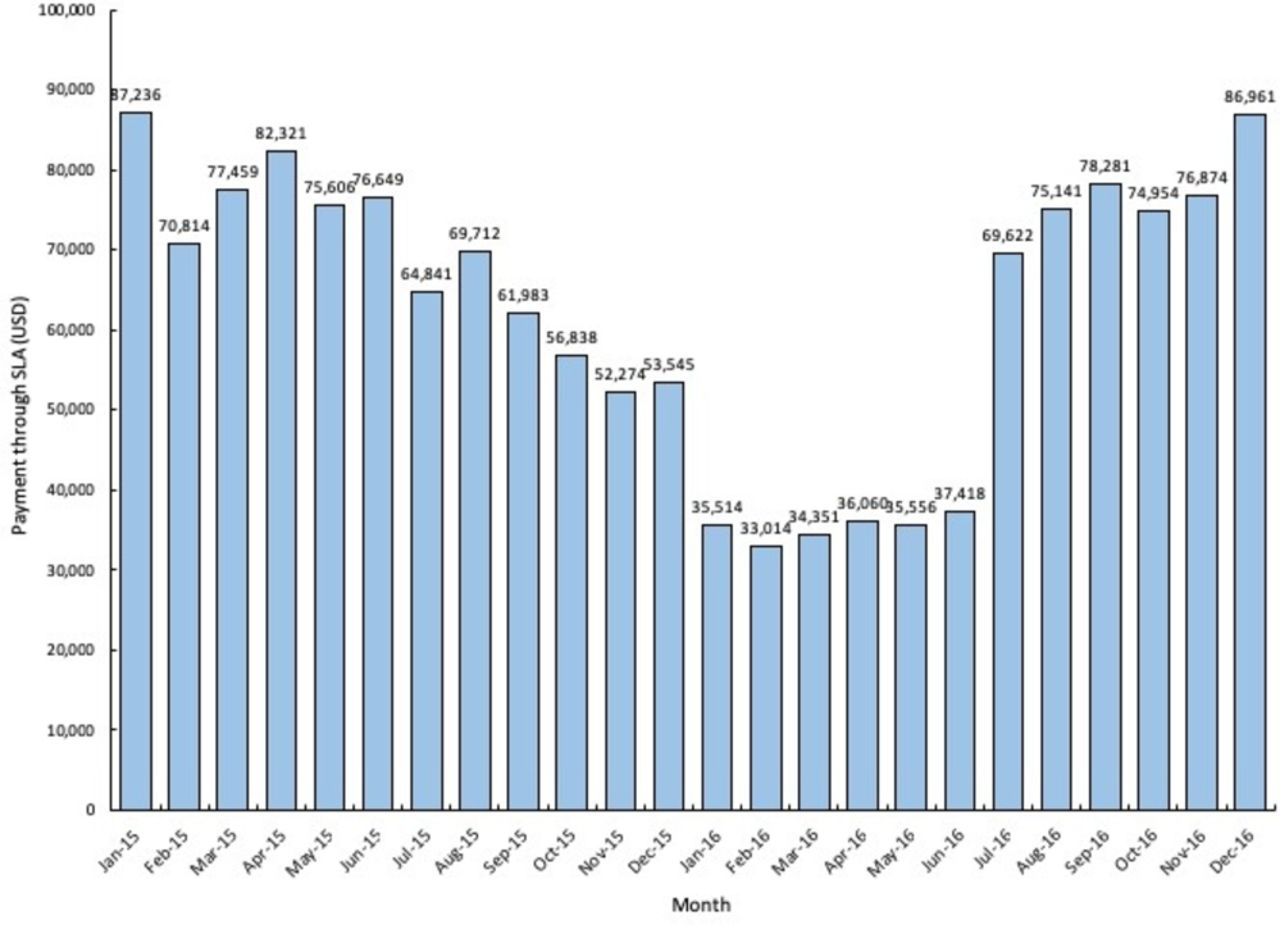
Total payment through SLAs per month. SLAs, service-level agreements.
Impact of SLAs on key MCH services
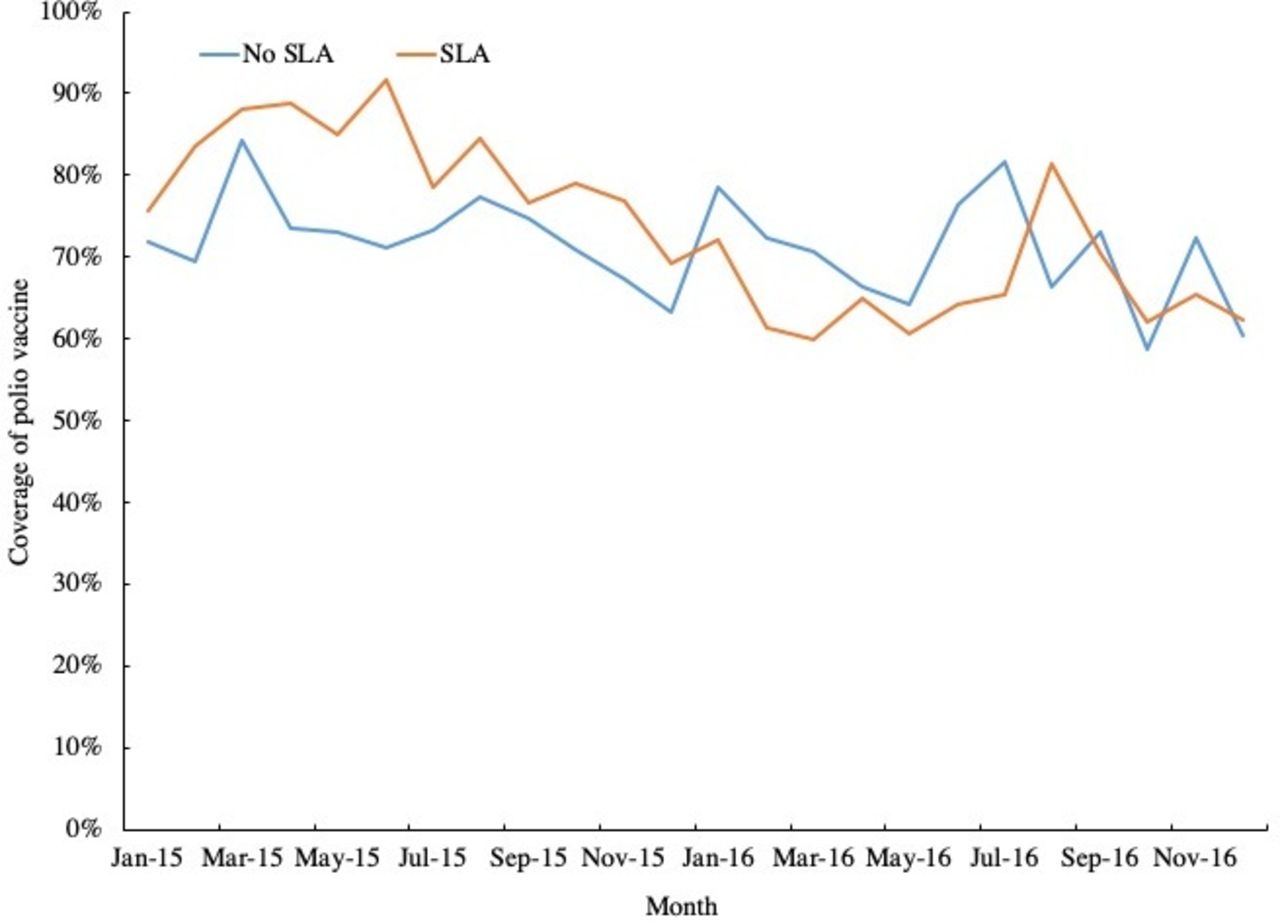
Figures 3–8 show the average coverage of six MCH services between SLA and non-SLA facilities each month. In general, the coverage of ANC, PNC, DSBA and BCG vaccination was consistently higher in SLA facilities relative to non-SLA facilities. But the coverage of pentavalent and polio vaccine did not show a consistent pattern.

Coverage of any antenatal visit.

Coverage of postnatal care visit.
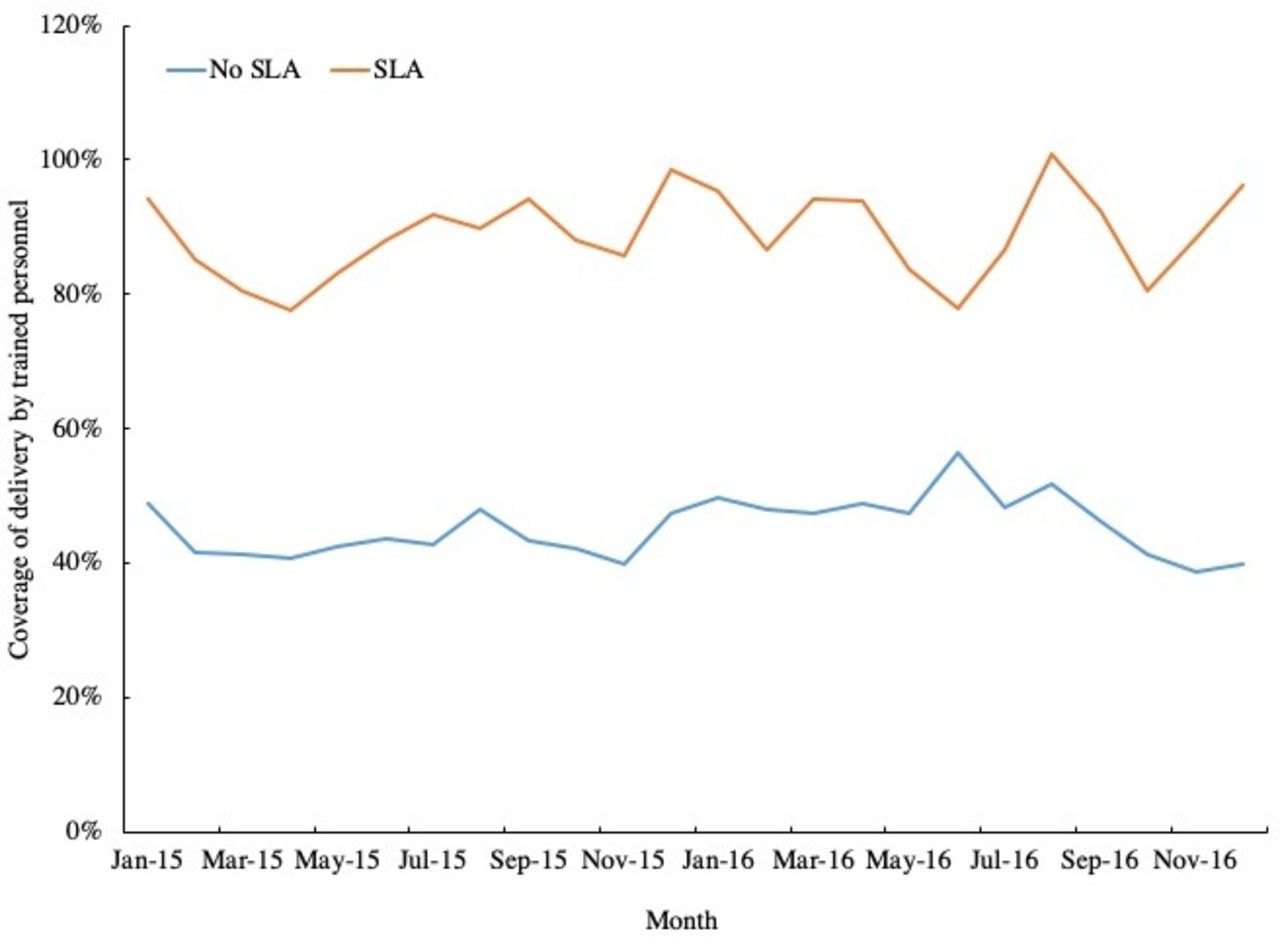
Coverage of delivery by trained personnel.

Coverage of BCG vaccination.
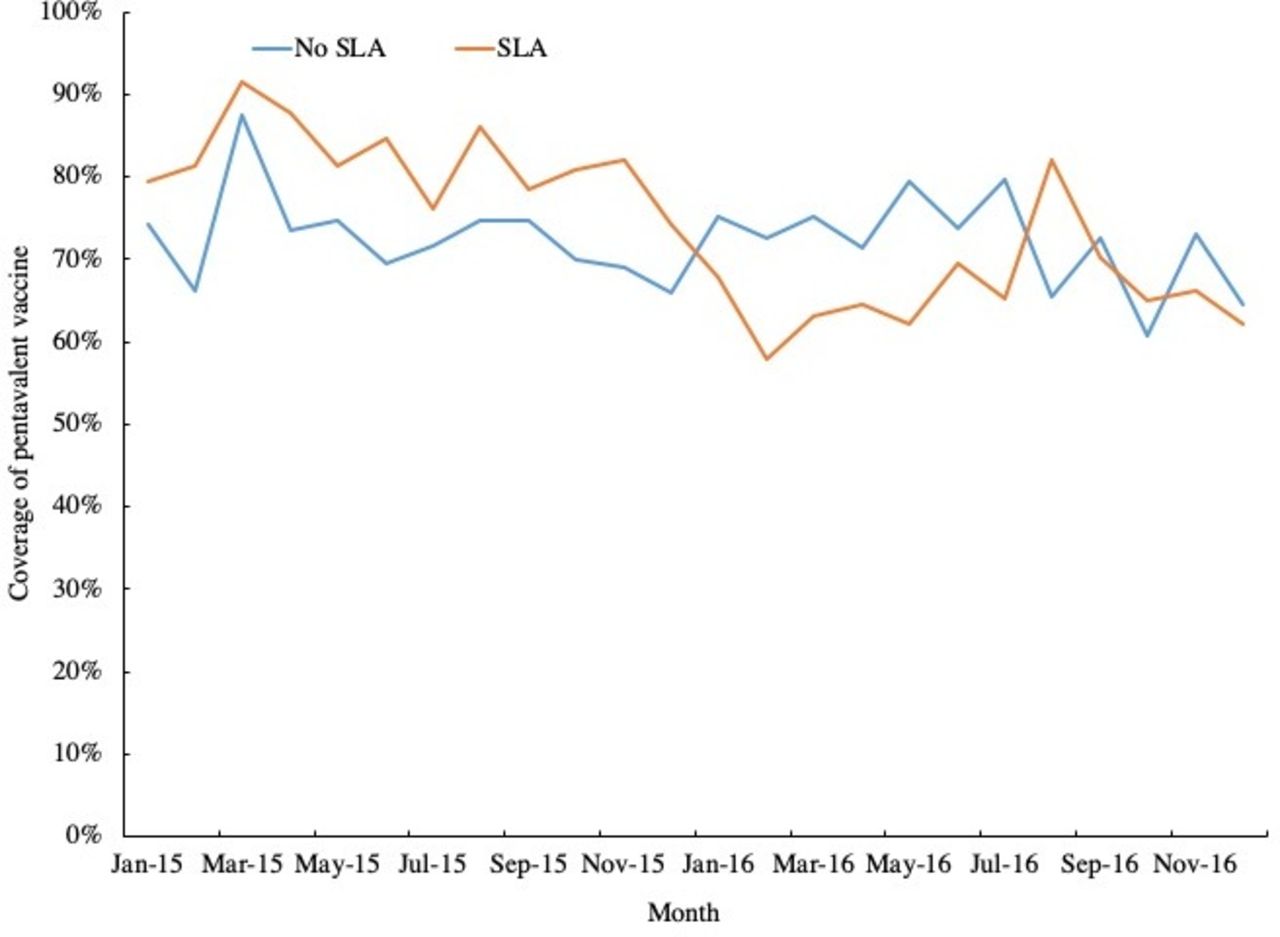
Coverage of pentavalent vaccination.

Coverage of polio vaccination. Note for figures 3–8: In some months, coverage for any antenatal visits and BCG exceeded 100%, due primarily to the denominator for the coverage calculation being estimated rather than the actual number of pregnant women based on the national share of the pregnant women. SLA, service-level agreement.
Table 2 provides the average visits per health facility per month for the six health services between SLA and non-SLA CHAM facilities over the 2 years. As the number of health facilities under SLA varied in different months, table 2 does not provide the sample size in each group. It shows the average visits per months was higher at the SLA facilities than non-SLA facilities. The differences were statistically significant, and DSBA and PNC had the largest relative difference.
Average visits per month per facility between SLA and non-SLA CHAM facilities
To estimate the average impact of SLAs over the 2 years, table 2 shows the results without controlling for seasonal impact. However, the results that controlled for the time effect are shown in online supplementary appendix 3 (table A1), which are similar to those in table 2. As shown in table 3, SLAs improved the coverages of any ANC visits by 13.8%, postnatal care by 13.1%, DSBA by 19.2%, and BCG by 9.6%. The impact of SLA on the above four indicators was statistically significant (p<0.05). However, the impact of SLAs on pentavalent vaccine and polio vaccine was not statistically significant, although trending in a positive direction.
Random-effects model examining the impact of SLAs on maternal and child health services
Estimation of lives saved and quality-adjusted life years saved
Using LiST, the improvement in the above six indicators was translated to a total of 434 lives saved over the 2 years 2015–2016), with a 95% CI 355 to 512 lives saved, comprising 370 lives saved for children under 5, and 64 lives saved for pregnant women (table 4). The key parameters used in LiST were presented in online supplementary appendix 4 table A2 and the number of lives saved by causes of death was shown in online supplementary appendix 5 table A3. Based on Malawi’s life table, an estimate of 11 161 QALYs was gained from the implementation of SLAs, with the 95% CI 9125 to 13 174 QALYs (table 3).
Life saved and QALYs gained from SLAs
Incremental cost-effectiveness ratio (ICER)
Table 5 shows the ICERs of SLAs in comparison with the status quo (without SLAs). The ICER for SLAs in terms of cost per life saved was estimated at $3463 (95% CI $2936 to $4234). Translating this into cost per QALY gained results in an estimate of $134.7, with 95% CI $114.1 to $164.7 per QALY gained. The GDP per capita in Malawi in 2015 was $381.4.28
Incremental cost-effectiveness ratio of SLAs
Discussion
Ideally, the ICERs of SLAs in Malawi should be judged against that of alternative programmes within the country, but we could not identify any cost-effectiveness studies for other MCH programmes in Malawi. This study found that the cost per QALY gained was $134.7. As Malawi’s 2015 per capita GDP was $363,27 these cost-effectiveness ratios represent 0.37 per capita GDP. Using the threshold of 1.5 times per capita GDP, SLAs proved cost-effective.
Consistent with another study on the impact of SLAs on utilisation of MCH services,6 our results demonstrate a favourable effect of SLAs on MCH services. In this study, the major increases of the utilisation of health services are ANC, PNC, DSBA and BCG vaccination. PNC and DSBA generally have a low baseline. For example, PNC had a based line of 31.0%, while the DSBA had a baseline of 57.8%. User fee exemptions have greater impact on such services, and less impact on services with high overage already, such as pentavalent and polio vaccinations. Although ANC visits usually have a relatively high coverage already, they too will likely increase when packaged with DBSA in SLAs. Additionally, CHAM was responsible for a small share of vaccination visits in Malawi, and a majority of children received their vaccines at public health facilities.29 Thus, the impact of user fees was limited on vaccination.
The CHAM facilities under SLAs are located in remote areas where there is no public facility within 8 km. Populations living in those areas encounter great physical access barriers to healthcare and very likely considerable financial barriers as well. Some pregnant women complained that when CHAM facilities charged user fees, in order to save money, they had to spend a substantial amount of time walking to public health facilities to receive care.4 In addition, the potential costs and time spent to travel to health facilities may deter pregnant women from seeking care in public health facilities if no CHAM facilities were available.4 5 Other factors, such as cultural norms, quality of care and attitudes of health workers could also affect the use of healthcare.4 Thus, contracting out services to CHAM likely has even further benefit at the client level to improve both physical access and potential financial burden, at least saving transportation costs. For this reason, from a societal perspective, which includes costs borne by households, SLAs have the potential to be even more cost-effective. Further cost-benefit analysis of SLAs from the client perspective would quantify additional efficiencies.
The cost-effectiveness analysis in this study compares SLA with non-SLA CHAM facilities. The counterfactual scenario could also be the case in which the government builds health facilities where CHAM facilities under SLAs are located. Under this circumstance, contracting CHAM facilities using SLAs is also likely to be cost-effective. First, new facilities would require a significant amount of upfront investments to construct the health facilities, purchase equipment and recruit and train health personnel. If recurrent costs for running a public facility, such as salaries for health workers (eg, doctors and nurses), medicines and costs of water and electricity, were similar to those for running CHAM facilities, assuming the coverage of key MCH services increases in the same magnitude as what was estimated in this study, contracting with CHAM would save the government a substantial amount of the upfront costs to establish new facilities. Second, only if/when newly established facilities are significantly more efficient in providing health services than are CHAM facilities with savings of operational costs offsetting the upfront costs, would it be better to establish government facilities instead of contracting CHAM facilities. The efficiency of health service delivery in public sector has been a concern in Malawi.30 31 Even if public health facilities are as efficient as CHAM facilities, we still have to assume establishing government facilities has the same impact as contracting CHAM has, which may not be correct, given that CHAM facilities have a better quality of care4 32 and that new facilities would have to compete with CHAM facilities for patients. Thus, from the government’s perspective, contracting with CHAM facilities to provide an essential package of health services is likely to remain cost-effective. It should be acknowledged that the above speculation assumes that government facilities provide a similar amount of health services at similar costs and with similar quality of care as SLA CHAM facilities do. If this assumption is violated, then the conclusion of the cost-effectiveness of SLAs could not be valid. Other factors, such as selection of location, operation and management of future health facilities, may also affect health outputs and costs, and thus the cost-effectiveness of SLAs.
Although SLAs prove to be cost-effective, the following potential refinements could be considered to enhance SLAs’ value for money: (1) Strategic contracting based on performance. The GOM uses an output-based approach to pay for health services to CHAM facilities. However, the coverage of key MCH services remains low in some facilities with SLAs, and additional incentives for achieving a set goal for those facilities may help accelerate the pace of covering more vulnerable populations; (2) Refinement of price list for services. The price list was developed through MoH’s consultation with the CHAM Secretariat and may not necessarily reflect the costs of service provision. More detailed costing analysis of essential health services within CHAM facilities would be useful to refine the prices list; (3) Streamlining the reporting system to reduce reporting burden. Falsification of reporting SLA health services was disclosed, distorting the relationship between DHOs and CHAM facilities.5 Under the new SLAs, MoH needs to ensure that services are reported accurately and (4) Capacity enhancement of CHAM facilities. As the CHAM Secretariat assumes more responsibility for financial management and service validation under the new MOU, it is important to strengthen CHAM’s capacity in both areas33 and the MoH should enforce for CHAM-facility regulations to avoid potential gaming.
Several limitations should be acknowledged in this study. First, the cost-effectiveness analysis was conducted from a pure government perspective, and the cost captures only payments to CHAM facilities under SLAs. If the costs borne by CHAM facilities are included, the ICER will increase by 42.9% (30%/70%*100%) proportionally. Second, for the effectiveness measures, the study focuses on MCH, but neglects curative treatment for common illnesses included in SLAs, which may result in an underestimation of the effectiveness of SLAs. Third, we used Malawi’s national statistics as parameters for the modelling in LiST, such as population growth, and allocation of institutional deliveries by levels of health facilities. These parameters may not accurately reflect the statistics in this study’s catchment area covered by SLAs implemented facilities.
Acknowledgments
We appreciate the leadership of HP+/Malawi, particularly Mrs. Olive Mtema and Mrs. Erin McGinn, for excellent management support, and Mrs. Clare Hurley from Brandeis University for editorial assistance.
References
Footnotes
WZ and DS contributed equally.
Handling editor Valery Ridde
Contributors WZ conceived, designed and implemented the study. DS, TH and JEN contributed to the statistical analyses. HM contributed to data collection. PS-F, GM, SS and AD contributed to the design of the study and quality control. WZ, DS and TH drafted the manuscript. All authors contributed to critically reviewing the manuscript and the interpretation of the results.
Funding This study is funded by the USAID supported Heath Policy Plus (HP+) Project.
Disclaimer Views expressed in this article are those of the authors and do not necessarily reflect the views of the authors’ institutions or the funder of this study.
Competing interests None declared.
Patient consent for publication Not required.
Provenance and peer review Not commissioned; externally peer reviewed.
Data availability statement Data were primarily obtained from DHIS2 owned by the Ministry of Health, Malawi